
What programmatic DOOH attribution is trying to answer
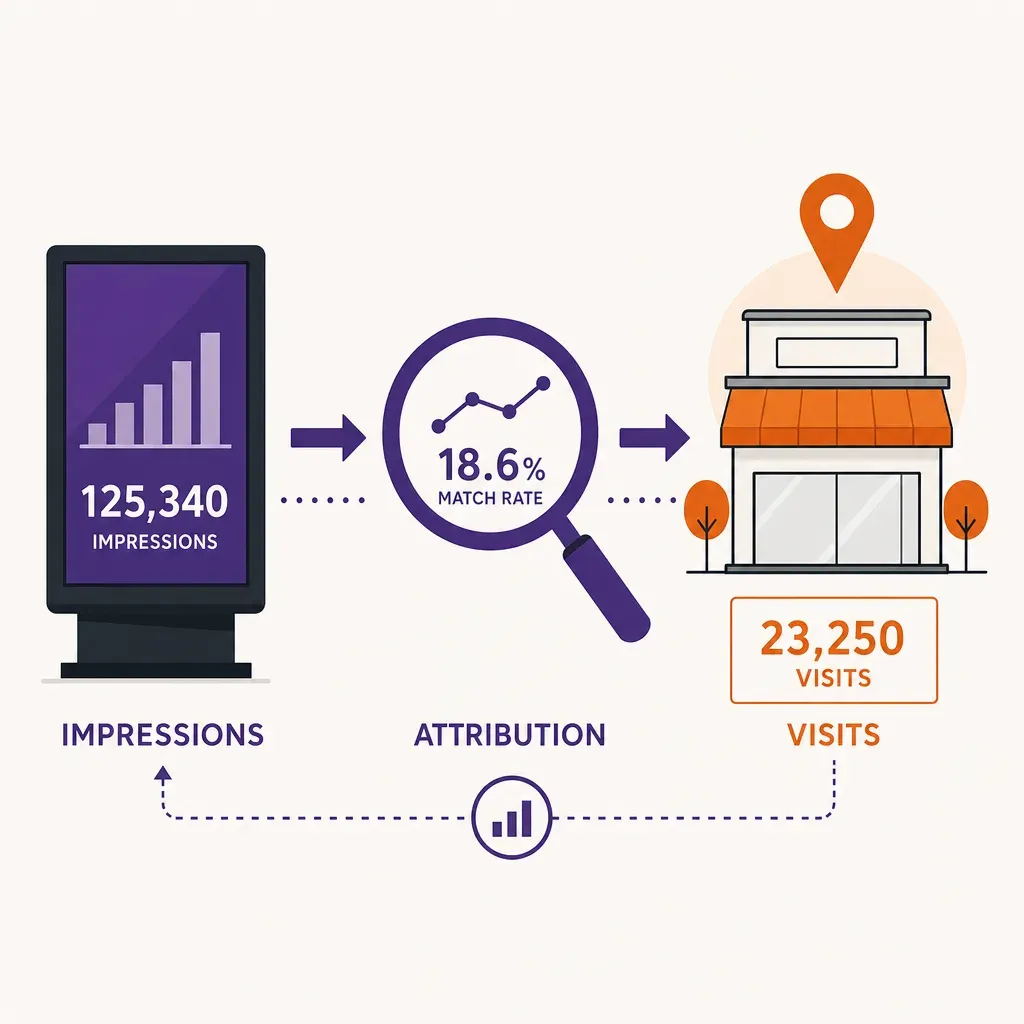
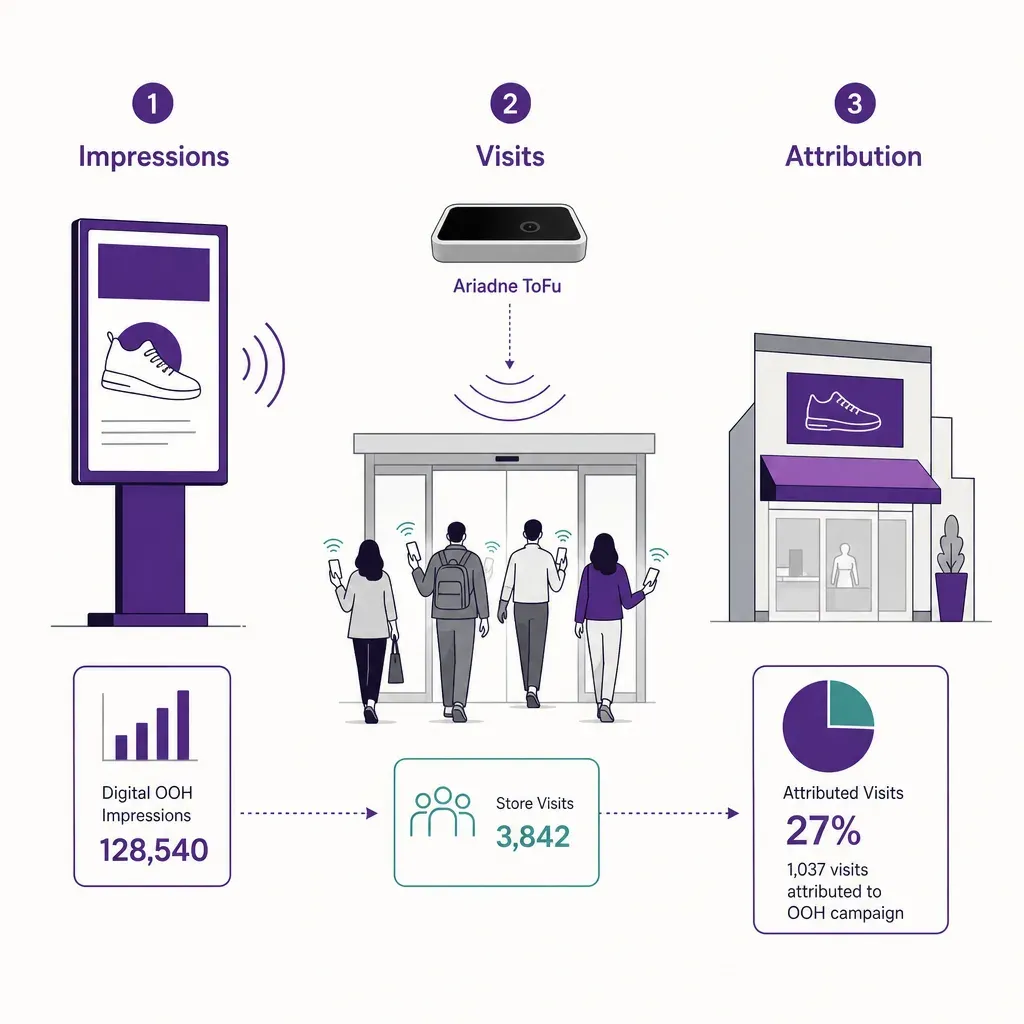
An advertiser who buys a programmatic digital out-of-home campaign wants to know one thing at the end of the flight: did the screens drive people into the store. The impression count and the reach figure tell them how many people had an opportunity to see the creative. Attribution is the layer that tries to connect those impressions to a measurable visit, a sale, or a downstream action. It is the question that programmatic DOOH spent the last five years trying to answer properly, and the question that more advertisers in 2026 are willing to spend against once the answer is auditable.
This post walks through how attribution actually works for a programmatic DOOH buy in 2026: how the data flows through a clean room, what deterministic and probabilistic matching are doing inside that flow, what a lift study is measuring and how it is structured, what attribution windows make sense by retail category, and where in-venue counting fits into the chain. It is aimed at the planner, the measurement lead, or the operator's data team specifying or auditing attribution on a digital signage network, not at the person writing the creative.
The end-to-end attribution flow
An attribution report for a programmatic DOOH campaign rests on six pieces of data flowing through one secure environment. Each piece comes from a different party, so the work is mostly about getting them into the same place under terms that the lawyers will sign.
- Playout log. The operator's record of which creative played on which face at which timestamp. This is the spine of any attribution model; everything else hangs off it.
- Impression audience. The audience figure associated with each play, produced by the currency body (GeoPath in the US, the relevant JIC in Europe) or by an accredited measurement provider. This is what turns a play into an impression count.
- Exposure geography. The location and coverage footprint of each face: where it sits and which audience it could plausibly have reached. This is what allows the model to define an exposed group and a control group later.
- Mobility data. Aggregate device-movement panels, supplied by location-data providers, that show how groups of devices moved through the exposed and control areas during and after the campaign. This is the input that lets the model decide whether someone exposed to the face later visited the store.
- Visit or sale signal. The downstream event being attributed: a store visit, a transaction, an online action. For physical-retail attribution, the visit signal usually comes either from the same mobility panel or from the advertiser's own first-party data on stores and POS.
- Identity bridge. Whatever mechanism the clean room uses to match exposure to outcome without exchanging raw identifiers. This is the part that makes deterministic matching possible where the data permits it and falls back to probabilistic matching where it does not.
The data clean room: where attribution actually runs
A data clean room is a controlled environment where two or more parties can run joint analysis on each other's data without either party exposing their raw records. The clean room enforces a few hard properties. Inputs are encrypted in transit and at rest. Queries are pre-approved against an agreed set of operations. Outputs are aggregated to a minimum cohort size before they leave the environment, which prevents the result of any single query from re-identifying an individual. Audit logs record every query and every output. The clean-room operator is usually a neutral third party or one of the major cloud providers' clean-room products.
For programmatic DOOH attribution, the clean room is what makes the rest of the flow legally and contractually possible. The operator brings the playout log and exposure geography. The currency body or measurement partner brings the audience and impression data. The mobility provider brings the device panel, joined against the exposure footprint. The advertiser brings their store list and visit signal. The clean room joins the data inside its secure environment, runs the agreed attribution queries, and returns aggregated results to each party. No raw device IDs cross between parties. No advertiser POS records leave the advertiser's side. The result is the attribution figure, not the underlying data.
Under the GDPR and equivalent regimes, this matters for two reasons. First, the clean-room architecture supports lawful processing on a joint-controller or processor basis where the contractual layer is properly drawn up. Second, the aggregation thresholds are the technical mechanism that keeps the output from being personal data: a result reported only at a cohort of N or larger, where N is set high enough that no individual can be re-identified from the figure. The 2026 norm for DOOH attribution is to run the join in a clean room rather than to ship raw data between vendors.
Deterministic vs probabilistic matching
Inside the clean room, the join between exposure and outcome happens one of two ways, and most real attribution models use both. The choice is a function of what identifiers are present in each data set and how reliably they tie back to a real visit.
Deterministic matching
Deterministic matching joins two records when they share an identifier that points to the same person or device. The classic example outside DOOH is a hashed email matched between an advertiser's CRM and a publisher's logged-in user file. For programmatic DOOH, deterministic matching is harder because the medium itself is not logged in. There is no DOOH equivalent of a cookie or a logged-in user at the screen. The deterministic identifiers that do exist sit in the panels feeding the attribution model: a hashed mobile advertising ID in the location panel, a loyalty ID in the advertiser's first-party data, a transaction ID joined to a visit at POS.
Where deterministic matching applies in DOOH attribution is on the outcome side, not the exposure side. The exposed cohort is defined by being in the screen's audience footprint during the play window, which is a probabilistic membership. The outcome cohort, the people who visited or transacted, can be defined deterministically when the advertiser brings first-party visit or sale data into the clean room and matches it against the panel through a hashed identifier. The benefit of going deterministic on the outcome is the report is harder to overstate: each attributed visit is tied to a known device that actually entered the store, not modelled from movement patterns alone.
Probabilistic matching
Probabilistic matching joins records based on shared patterns rather than a shared identifier. For DOOH attribution, the probabilistic part of the model is doing two things. It is deciding which devices in the mobility panel were exposed to a given face during the play window, using their location pattern relative to the face's coverage footprint and the audience model behind the impression. It is also extrapolating from the panel to the full population: the panel is a sample, not a census, and the attributed visit count has to be scaled by the panel's coverage in the market.
Probabilistic methods carry more methodological weight, but they are not weaker by definition. The currency bodies' impression figures are themselves probabilistic, computed from traffic models with visibility corrections. The attribution model is doing the same kind of work, applied to the question of whether a member of the exposed audience later visited a store. The discipline that matters is whether the panel size, the modelling assumptions, and the scaling factors are documented and auditable. A probabilistic attribution figure with a published methodology is auditable. One without is a black box.
How the two combine
In a typical 2026 DOOH attribution flow, exposure is defined probabilistically (a device was within the face's coverage footprint during a play window), and outcome is defined as deterministically as the advertiser's data allows (the device matched a first-party visit or sale record, or, where that is not possible, the visit is inferred from the panel itself). The clean-room query joins the two cohorts, applies the panel scaling, and reports lift against a control group. Reports that present a single attributed-visit number without separating the deterministic component from the probabilistic component are hiding the methodology behind a tidy figure. Read the breakdown, not just the headline.
Lift methodology: what the report is actually measuring
Attribution for programmatic DOOH does not just report an attributed-visit count. It reports a lift figure: the difference in visit rate between the audience that was exposed to the campaign and a comparable audience that was not. Lift is the figure that controls for everything that is not the campaign, which is most of why a store gets visits in a given week. If you do not measure lift, you cannot tell the difference between the campaign's effect and the underlying base rate of visits.
A lift study for DOOH is structured the same way as any other media-lift study, with channel-specific definitions for the cohorts.
- Exposed group. Devices in the panel whose location pattern places them within the audience footprint of at least one campaign face during a play window. The threshold for inclusion (was the device within 50 metres of the face, did the device dwell within the coverage zone for at least N seconds) is set in the methodology before the campaign runs.
- Control group. Devices in the panel that match the exposed group on the relevant covariates (geography, demographic where available, baseline visit propensity) but were not within reach of any campaign face during the flight. Picking the control well is the hardest part of the model: a poorly chosen control inflates lift, and an over-tight control deflates it.
- Visit window. The period after exposure during which a visit is counted as attributable. This is the attribution window, treated separately below.
- Visit rate. Visits per device in each group, normalised to a comparable base. Lift is the ratio (or absolute difference) between the exposed and control visit rates.
The output a buyer sees is usually expressed two ways. Incremental lift is the percentage difference in visit rate between exposed and control (an exposed visit rate 18% above control means 18% incremental lift). Incremental visits is the count of additional visits the campaign is credited with, derived from the lift figure and the scaled exposed cohort. Both numbers should ship with the cohort sizes, the panel coverage, and the confidence interval; a lift figure without a confidence interval is not enough to plan against.
Attribution windows by category
An attribution window is the period after exposure during which a visit or sale is credited to the campaign. Pick the window too short and the campaign undercounts its real effect; pick it too long and the model is just counting visits the campaign did not drive. The right window depends on the category and the purchase cycle, not on what the operator's default report uses.
The figures below are typical industry ranges in 2026, not figures from a specific named study. They are intended to set the order-of-magnitude expectation for a planner specifying a window; the actual window for any campaign should be set against the advertiser's own purchase data where it exists.
- Quick-service restaurants, convenience, coffee. Same-day to 48 hours. The purchase decision is short and proximate; if exposure to a screen near the venue drove a visit, that visit happened soon after the play.
- Grocery and pharmacy. Two to seven days. Most shoppers have a weekly or twice-weekly cycle, and a screen seen at a transit stop on Monday might show up in the basket on Wednesday.
- Apparel and general retail. Seven to fourteen days. Browsing cycles are longer; visits cluster around the weekend after exposure.
- Consumer electronics, appliances, larger considered purchases. Two to four weeks. The visit follows research and comparison shopping; attribution windows shorter than two weeks miss most of the effect.
- Automotive and the longest considered categories. Four weeks and up, often with the brand-level effect measured separately from the dealership-visit effect.
- Entertainment, attractions, time-limited events. The window is the event window itself, set by the campaign rather than the category. Same-day exposure for a screening; a few weeks for a multi-day exhibition.
Two operational notes. First, the window applies per device, not per campaign: a device exposed on day one is counted against visits within the window from day one, regardless of when the campaign ends. Second, the window should align with the control group's reference period, so that the visit-rate comparison is on a like-for-like basis. A 14-day exposed window compared to a 7-day control window is a meaningless lift figure.
The role of in-venue counting
Outside-the-store attribution for DOOH leans on mobility panels and clean-room joins; that is the part of the chain that runs on devices and data. Inside the venue itself, where the screen actually plays to a real audience walking past it, the input the attribution model needs is something different. It needs to know how many people had an opportunity to see the screen, how long they stayed in its coverage zone, and how that audience changed across the day. That is the input people counting at the screen and across the venue provides, and it is the part of the chain that determines whether the impression count entering the attribution model is real or modelled.
There are three places in-venue counting feeds the attribution model directly.
- Impression weighting at the screen. The opportunity-to-see weighting that turns a play into an impression is more accurate when the actual audience walking past the face is counted at the face, not modelled from venue averages. For in-venue inventory, a count at the screen replaces a venue-level estimate, and the impression figure entering the clean room is one degree closer to the ground.
- Dwell as an attention proxy. Time spent in the screen's coverage zone is the closest in-venue analog to viewability. A creative seen by a fast-walking audience and one seen by an audience waiting in a queue produce very different attention levels, even at the same impression count. Dwell at the screen, measured without identifying anyone, feeds the attention layer of the report and lets a buyer compare faces on more than reach alone.
- Venue-level visit data. Where the venue runs people counting at its entries and across its zones, that data anchors the audience model. The attribution clean room can be told what the actual venue traffic was during the campaign, against which the device-panel exposure can be scaled and corrected. The panel is a sample of devices; the venue counter is a count of people. Pairing them tightens the attribution figure.
The 2026 expectation among more careful buyers is that in-venue inventory should carry venue-level audience data into the attribution flow, not just a roadside-style traffic model. The standards bodies have been pushing in this direction (MRC's revisions to its OOH guidelines, IAB's DOOH guidance on impression definitions, GeoPath's place-based methodology), and the practical effect is that an operator running unverified audience figures is increasingly at a disadvantage on the buy.
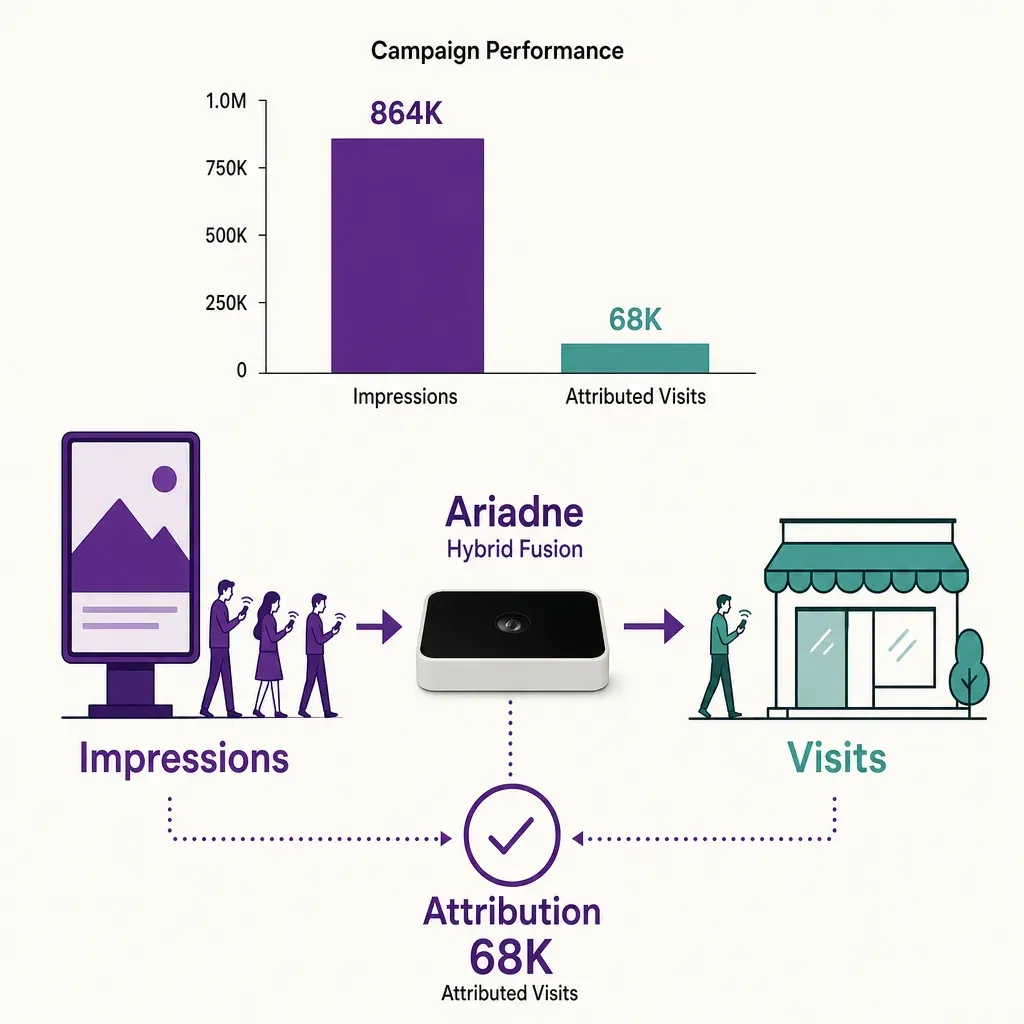
How Ariadne fits
Ariadne supplies the in-venue audience layer that feeds a programmatic DOOH attribution model. It does this without cameras, without face detection, and without capturing any personal data at the screen.
Ariadne measures this with Hybrid Fusion, its patented camera-free method. Time-of-Flight depth sensing counts every visitor at the entrances, capturing geometry rather than images, while patented phone signal sensing follows movement through the interior, detecting the signals a phone emits even in airplane mode. The sensor streams both feeds to Ariadne, where Hybrid Fusion combines them into one trajectory per visit and computes counts, dwell, and paths. The streams carry no identifier: no MAC address, no device ID, no biometric data, and no camera is involved. Identifiers are stored only when a visitor explicitly opts in, which keeps the method GDPR-friendly and outside biometric territory.
For an attribution model, that hardware and data design produce three useful properties. The impression weighting at the screen rests on a real visit count and a real dwell figure for the screen's coverage zone, both reported continuously through the campaign. The audience input crossing into the clean room carries no personal data, so the contractual and privacy work between the operator, the measurement partner, and the advertiser is simpler. And the venue-level counts that anchor the model are produced by the same sensor unit, so an operator running an Ariadne deployment is reporting from one source rather than reconciling two. The data handling and the no-personal-data design are described in the privacy policy, and the campaign-side reporting feeds the operator's visitor marketing reporting for the advertiser.
A buyer checklist for DOOH attribution
If you are auditing or specifying attribution on a programmatic DOOH buy in 2026, these are the questions worth putting to the operator, the measurement provider, and the clean-room partner in writing.
- Where does the attribution join actually run? It should run inside a named clean-room environment with an agreed query set and aggregation thresholds, not on a vendor laptop. Get the clean-room operator and the threshold figures in writing.
- What is the panel and what is its coverage? The mobility provider's panel size, geographic coverage, and known biases shape every figure in the report. Ask for the panel description and the scaling factors used to extrapolate to the market.
- How is the control group constructed? A good control is matched on geography, baseline visit propensity, and the relevant covariates. Ask how the control was drawn and how it was validated.
- What attribution window is being reported, and why? The window should reflect the category's purchase cycle, not the operator's default. Confirm the window and the rationale before the campaign launches, not in the report.
- Is the lift figure reported with cohort sizes and a confidence interval? A lift figure without an interval is not a planning input. Reject reports that present a single percentage without supporting figures.
- What is the in-venue audience input for indoor inventory? For digital faces inside a venue, ask what produces the visit and dwell figures at the screen. The answer should not be a camera and should not be a system that infers demographic categories from facial features.
- What identifiers, if any, cross between parties? The clean-room design exists so that raw identifiers do not. Confirm that the attribution flow is consistent with that design, and that the output thresholds keep results from being re-identifiable.
FAQ
Does programmatic DOOH attribution require cameras at the screen?
No. Ariadne counts with Hybrid Fusion: Time-of-Flight depth sensing plus patented phone signal sensing, never cameras. Time-of-Flight captures geometry rather than images, and signal sensing captures no MAC address by default, so the measurement involves no video, no faces, and no biometric data.
The audience input the attribution model needs at the screen is a visit count and a dwell figure, both of which can be produced without images, faces, or biometric data. Camera-based audience measurement at the screen is hard to defend under the GDPR and the EU AI Act, and the standards work has been converging on camera-free methods for in-venue inventory.
What is the difference between deterministic and probabilistic matching in this context?
Deterministic matching joins two records that share an identifier, like a hashed mobile ad ID present in both the location panel and the advertiser's first-party visit data. Probabilistic matching infers the join from patterns, like deciding a device was exposed because its location pattern placed it within the face's coverage footprint during a play. In practice, DOOH attribution uses both: exposure is defined probabilistically against the audience footprint, and outcome is defined as deterministically as the advertiser's data permits.
What attribution window should I use?
The window should reflect the category's purchase cycle, set against the advertiser's own purchase data where it exists. Industry-typical ranges run from same-day for quick-service restaurants and convenience, through one to two weeks for general retail, to four weeks and up for considered categories like consumer electronics and automotive. Pick the window before the campaign launches, document the rationale, and align the control group's reference period to match.
Is the attribution figure GDPR-compliant?
It can be, and the design that gets it there is the clean room plus aggregation thresholds: each party brings their data into a secure environment, the join runs inside that environment, raw identifiers do not cross between parties, and the output is aggregated to a cohort size that prevents re-identification. On the in-venue audience side, a counting method that captures no images, no faces, and no device identifiers by default is not processing personal data, which keeps the input crossing into the clean room outside the heaviest GDPR obligations. Confirm the specifics with your data protection officer and the clean-room partner, but the architecture is well-established in 2026.