How do you verify a people-counter accuracy claim?
Every people-counter vendor publishes an accuracy number, usually somewhere between 95 and 99 percent. Almost none publish the conditions that produced it: the entry width, the footfall density, the lighting, the group mix, and the length of the test window. Without those, "98 percent accurate" is unfalsifiable. This guide is the protocol that makes it falsifiable: a roughly four-hour on-site procedure any retailer can run on any vendor's counter, with no vendor cooperation required. It produces one repeatable accuracy number plus the range around it, so you learn not just how accurate a counter is on average but where it breaks. The procedure is vendor-neutral by design: run it on hybrid fusion counting accuracy or on any competing counter using the same steps.
Why "98 percent accuracy" is unfalsifiable without a protocol
A single accuracy number is an average, and an average hides exactly the conditions you care about. A counter can be 99 percent accurate on quiet, single-file, well-lit, solo traffic and drop to 80 percent at a busy entrance during a weekend lunch rush. Blend those and the headline still reads 95 percent, while the number you actually run your store on, peak-hour accuracy, is far worse. These are the failure modes an aggregate number conceals:
- Group dilution. Families and pairs entering together collapse into one count on counters that cannot resolve distinct people.
- Low-light degradation. Vision-based counters lose accuracy in dim or high-glare conditions; depth and signal sensing are far less affected.
- Peak-hour saturation. As density rises, bodies occlude one another and merge, so error climbs exactly when traffic matters most.
- Bidirectional drift. Counters that handle exits and re-entries poorly accumulate error over a full day.
- Entry-width effects. A wide doorway lets people pass side by side or skirt the detection zone, both invisible in a quiet-hours test.
The 5 variables that move the accuracy number
Entry width
The wider the opening, the more people can cross abreast or slip along the outer margin of the detection field. A counter validated on a 1-metre single-file doorway will not hold the same accuracy on a 4-metre mall entrance. Always note the entry width and whether the sensor's field covers the full opening.
Footfall density
Accuracy measured at 10 people an hour tells you nothing about 400 people an hour. Density drives occlusion: the more people in frame at once, the more they overlap and merge. Test across the real range your door sees, not a convenient quiet hour.
Lighting
Direct sun, glare off a glass entrance, and dim evening light all degrade camera-based counting. Time-of-Flight depth sensing measures distance with its own infrared light, so it holds in low light and dense crowds where 2D vision struggles. Record the lighting at the test door, including any time-of-day glare.
Group mix
The share of visitors arriving in pairs and families is the single biggest swing factor for naive counters, because a group that crosses together is counted once. A door with a high family mix will expose group blindness that a solo-heavy door hides.
Time window
A 20-minute test captures one density and one lighting condition. A real accuracy figure needs a window long enough to span quiet and peak, ideally four hours including at least one rush, so you can report accuracy as a range, not a flattering single point.
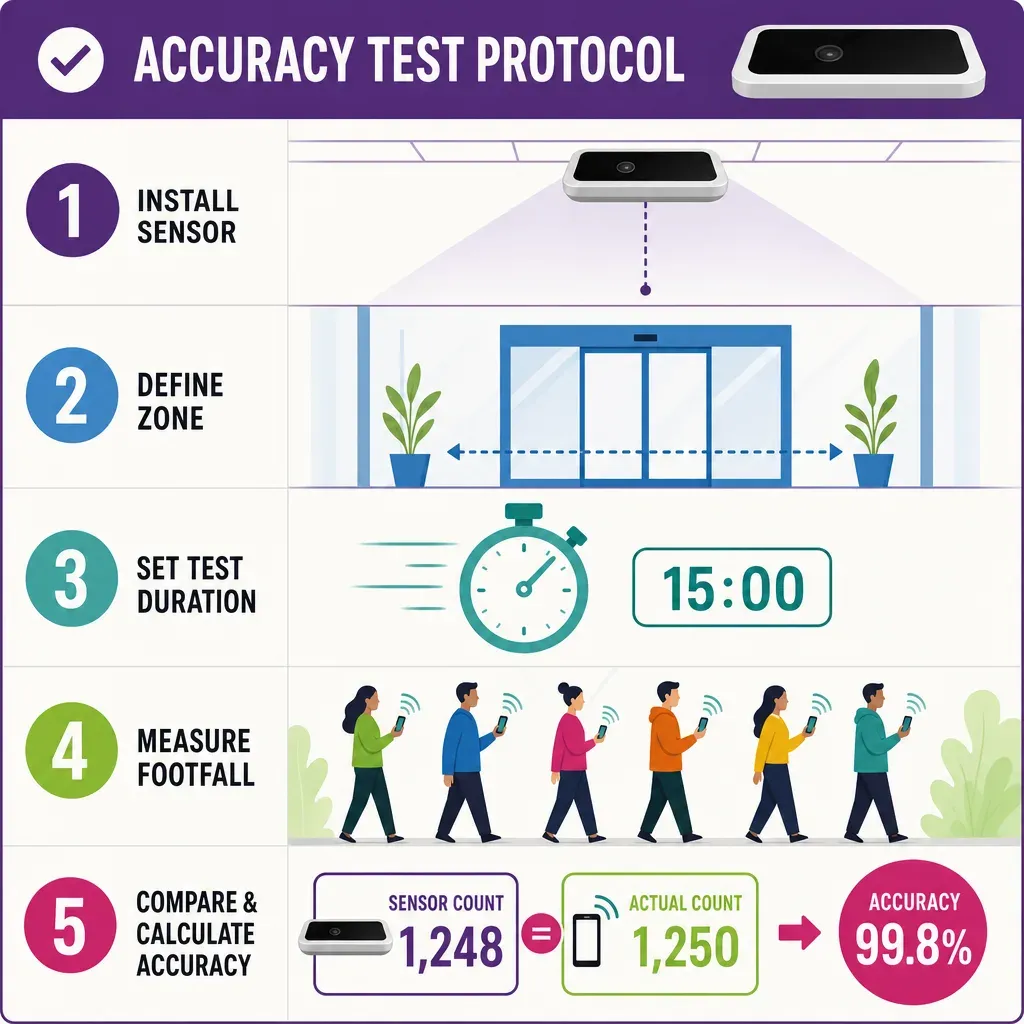
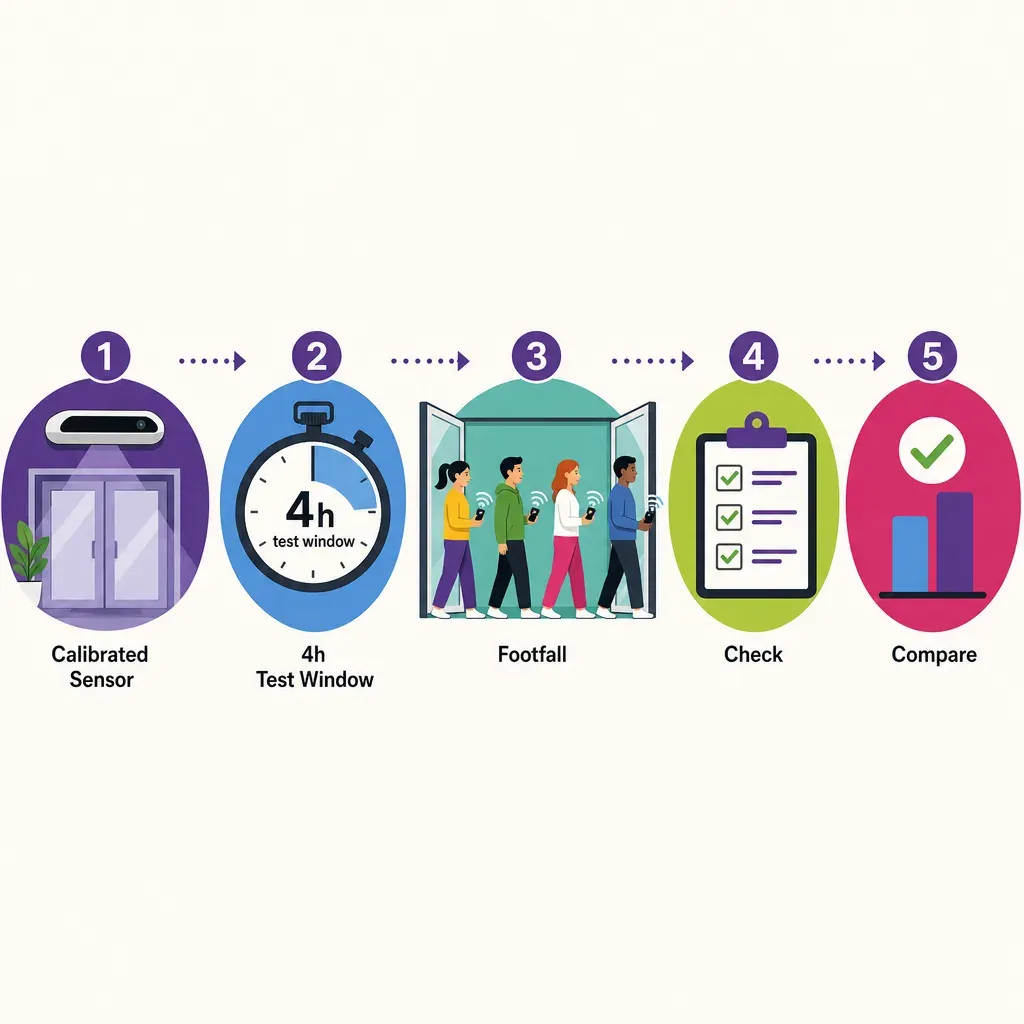
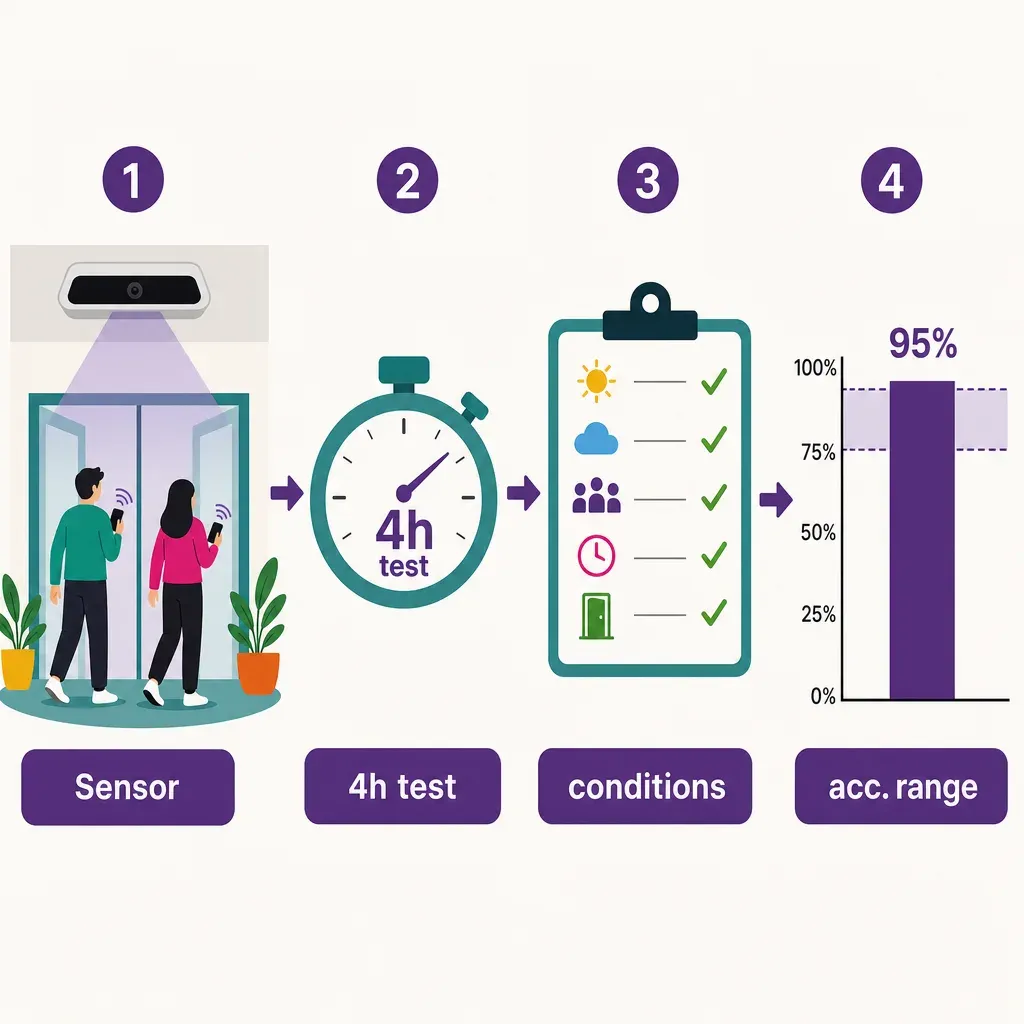
The 4-hour on-site test protocol
This produces a defensible accuracy figure for one door under real conditions. You need two people, clickers or a counting app, and access to the counter's per-interval export.
- Set up ground truth. Pick your busiest single door and a four-hour window that spans both a quiet stretch and at least one peak.
- Count by hand. Two observers independently tally every person who crosses inward, counting each member of every group. Two counters let you measure your own human error and reconcile disagreements.
- Bucket the window. Split the four hours into 15-minute buckets, so you can see accuracy change with density rather than averaging it away.
- Export the counter. Pull the vendor counter's inward count for the same door and the same 15-minute buckets.
- Reconcile. For each bucket, error equals (counter count minus manual count) divided by manual count. A positive number is over-counting, a negative number under-counting.
- Break error down by failure mode. Tag each bucket with its density, group mix, and lighting, so you can see whether error concentrates at peak, in groups, or in low light, not just that it exists.
- Report an interval, not a point. Quote the mean absolute error and the range across buckets. "94 percent mean, 88 to 99 percent across buckets" is honest; "98 percent" alone is not.
A spreadsheet makes this repeatable. One row per 15-minute bucket, with columns: bucket start time, manual count (observer A), manual count (observer B), reconciled manual count, counter count, error percent, density tag (low/medium/peak), group-mix note, lighting note. The error percent column and a simple min/mean/max across rows give you the headline and the interval.
How to read the result
There is no universal "good" number, because the right target depends on your door, your density, and what you use the count for. What matters more than the mean is the spread. A counter that averages 98 percent but swings from 85 to 100 percent across buckets is unreliable exactly when you are busiest, and a stable 95 percent may serve you better. For conversion and staffing decisions you want a small, predictable error, not a high average that hides peak-hour collapse.
To compare vendors, run the identical protocol on the same door and window for each. Only then are two accuracy numbers comparable. A category review of people-counting systems is a starting shortlist, but your own four-hour test on your own door is the number that should decide a purchase.
When to ask the vendor, and what to ask
Some facts you can only get from the vendor, and they belong in writing before you buy. Lock these five:
- Which sensor model and firmware version produced the published accuracy number, and is it the same one you are buying?
- Under what test conditions was that number measured: entry width, density, lighting, group mix, and window length?
- Is counting bidirectional, and how are exits and re-entries handled?
- Does it resolve groups, or does a family entering together count as one?
- What personal data does it capture, if any? You want identifier-free counting: no faces, no MAC address by default, opt-in only.
Match the answers against the sensor you actually test. The Ariadne sensor lineup lists the models so you can confirm firmware and mounting before a trial.
Worked example: a department-store deployment
A worked illustration, with the kind of numbers a real four-hour test produces. A department store runs the protocol on a vendor's entrance counter across a weekday, splitting the window into 15-minute buckets:
- Quiet morning (low density, solo). Counter 99 percent of the manual count. Easy conditions, headline-friendly.
- Late morning (medium density). 96 percent, small under-count as pairs appear.
- Lunch peak (high density, high group mix). 88 percent, the counter loses groups and merges crowded entries.
- Afternoon (medium density). 95 percent, recovering as the crowd thins.
Mean absolute accuracy across the day lands near 94 percent, with a range of 88 to 99 percent. The vendor's "98 percent" was real, but only for the quiet-morning condition. The four-hour test reveals the part that matters: a predictable peak-hour weakness driven by group and density, which is the difference between a counter you can run conversion on and one you cannot.
How Ariadne holds accuracy across the five variables
Run the same protocol on an Ariadne sensor and the five variables behave differently, because the design removes the usual failure modes rather than averaging over them. We are not asking you to take a headline number on faith. We are saying where the common weaknesses come from and why this approach does not share them:
- Entry width. The Time-of-Flight field is sized and mounted to cover the full opening, and the patented signal sensing reads the same visit independently across the interior, so anyone missed at a wide or busy doorway is still picked up and reconciled centrally.
- Footfall density. Time-of-Flight depth sensing reads geometry sub-second, and the patented signal sensing adds an independent count of phone-carrying visitors, so where a crowd challenges one feed the fusion layer cross-checks it against the other instead of merging overlapping bodies.
- Lighting. Time-of-Flight measures distance with its own infrared light and uses no camera, while the patented signal sensing is radio-based and uses no light at all, so dim evenings, glare off a glass entrance, or near-darkness do not degrade either feed.
- Group mix. Ariadne's patented signal sensing resolves distinct people in a group, while Time-of-Flight adds a device-independent body count, so a family does not collapse into one.
- Time window. Hybrid Fusion processes both feeds centrally, and because the patented signal sensing follows each visit as a trajectory, a re-entry is recognised as the same visit rather than a new one, so bidirectional counting does not drift across a full trading day.
None of that exempts Ariadne from the test. The point of a vendor-neutral protocol is that you run it on us too, on your own door, and hold the result to the same standard as everyone else.
FAQ
Can I trust a vendor's published accuracy number?
Only alongside its test conditions. Without the entry width, density, lighting, group mix, and window, a published figure is marketing, not a measurement. Ask for the conditions in writing, or run the four-hour test yourself.
How accurate is good enough?
It depends on the decision. For directional footfall trends, a stable 95 percent is fine. For conversion, where the count is the denominator, you care about a small and predictable error across peak hours more than a high average. Judge the spread, not just the mean.
Do you need cameras to count accurately?
No. Ariadne counts with Hybrid Fusion: Time-of-Flight depth sensing plus patented phone signal sensing, never cameras. Time-of-Flight captures geometry rather than images, and signal sensing captures no MAC address by default, so the measurement involves no video, no faces, and no biometric data.