
Why anchor tenants pay less per square metre
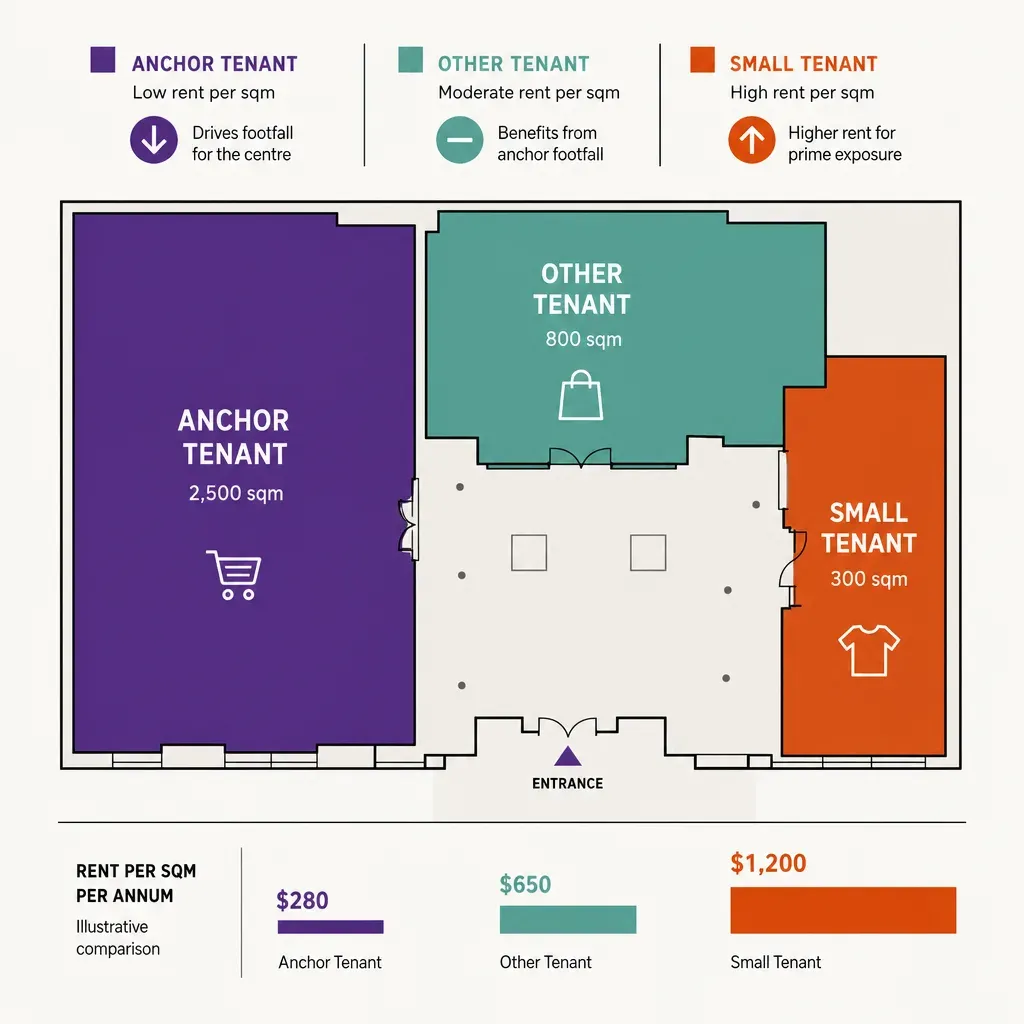
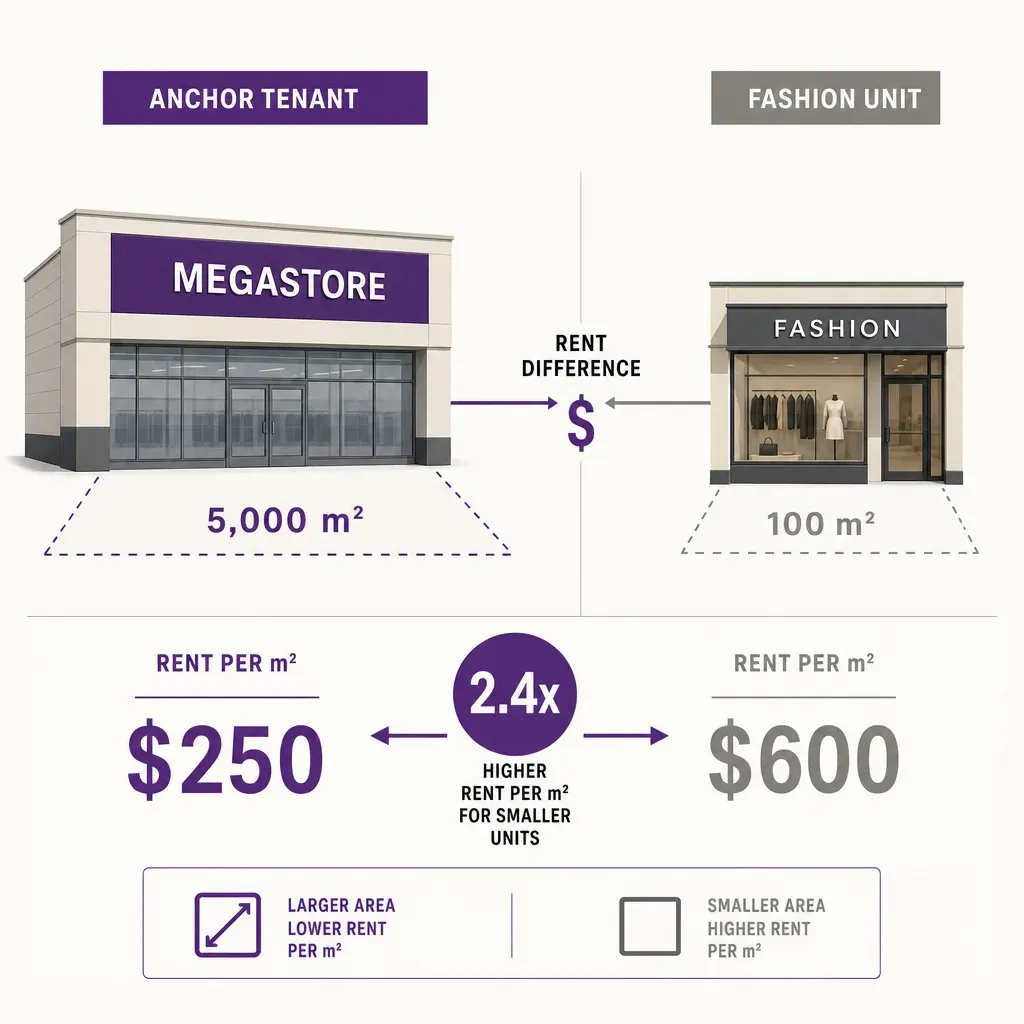
Look at the rent roll of almost any enclosed shopping centre and you find an arrangement that surprises people outside the property world. The largest tenant in the building, the department store or the supermarket that occupies a third of the leasable area, often pays the lowest rent per square metre of anyone in the scheme. A small fashion unit near the food court can pay several times the rate per square metre that the anchor pays, despite renting a fraction of the space.
This is not a mistake or a failure to negotiate. It is the central mechanic of how a shopping centre works as a business. The anchor is not paying for floor space in the way a small tenant is. It is being paid, in effect, to generate the visitors that the rest of the centre then sells against. Anchor tenant lease economics is the study of how that exchange is priced, structured, and, increasingly, measured.
This article walks through the four pieces that make the model work: why anchors command low base rent, how percentage rent and common area charges fit around it, how an anchor sets the rent every other tenant pays through co-tenancy, and how footfall data is starting to put a number on a contribution that used to be argued by instinct. The figures used throughout are illustrative examples chosen to show the mechanics clearly. They are not market averages, survey results, or measured outcomes from any particular centre.
The base rent gap, and what it actually buys
Start with the asymmetry itself. An anchor takes a large, often purpose-built footprint on a long lease, frequently fifteen to twenty-five years, sometimes with options that stretch further. A small specialty tenant takes a few hundred square metres on a five or ten year term. Those are different products, and they price differently.
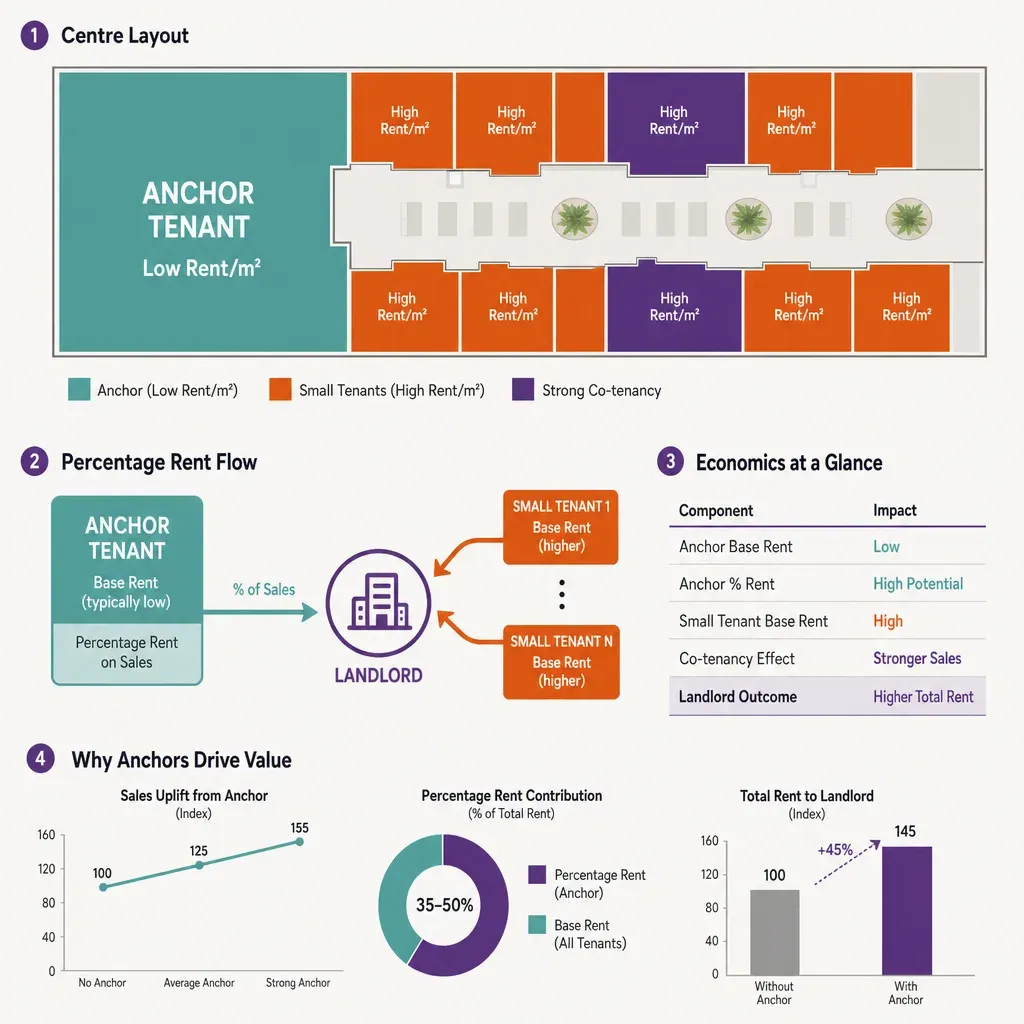
Consider an illustrative centre. The anchor occupies 12,000 square metres and pays a base rent of 80 currency units per square metre per year. A typical inline fashion unit occupies 200 square metres and pays 600 units per square metre. The anchor pays 960,000 a year for a third of the centre; the inline unit pays 120,000 for a sliver of it. On a per-square-metre basis the small tenant pays roughly seven and a half times more.
What the landlord buys with that gap is a draw. A recognised anchor gives shoppers a reason to make the trip and a destination to walk toward once they arrive. The landlord is effectively buying guaranteed visitor volume, on a long enough lease that the rest of the leasing strategy can be built around it. The cheap rent per square metre is the price of that volume. The expensive rent the small units pay is, in part, them buying access to it.
The same logic explains why some anchors pay close to zero base rent, or take an inducement to sign at all. If the anchor is strong enough that its presence materially lifts every other rent in the scheme, the landlord can rationally give the space away and still come out ahead on the rent roll as a whole. The anchor deal is a loss leader on one line of the rent roll that pays for itself across all the others.
Percentage rent: sharing the upside
Low base rent is only half of the anchor deal. The other half is percentage rent, sometimes called turnover rent or overage. The tenant pays a low fixed base, then an additional percentage of sales above an agreed threshold, the breakpoint. This lets the landlord keep the base affordable while still sharing in the success the centre helped create.
A simplified percentage rent clause has three numbers:
- The base rent. A fixed annual amount the tenant pays regardless of sales.
- The percentage rate. The share of qualifying sales the tenant pays above the breakpoint, often a single-digit percentage that varies by tenant type.
- The breakpoint. The sales level above which percentage rent starts. A natural breakpoint is set so the base rent equals the percentage rate applied to it, meaning percentage rent begins exactly where the tenant has earned back its base in sales terms.
Work the illustrative anchor through it. Say the anchor pays 960,000 in base rent and the lease sets a percentage rate of 2 percent. The natural breakpoint is the base divided by the rate: 960,000 divided by 0.02, which is 48 million in annual sales. Below 48 million the anchor pays only its base. If the anchor turns over 60 million, it pays the base plus 2 percent of the 12 million above the breakpoint, an extra 240,000, for a total of 1.2 million.
The structure aligns the two sides. The landlord wants the anchor to trade well, because the landlord earns more when it does, both directly through percentage rent and indirectly through the foot traffic a busy anchor generates. The anchor accepts a turnover share in exchange for a base rent it could never justify at full market rate for that much space. Neither side is doing the other a favour; the lease just routes the upside to whoever takes the risk of a slow year.
Percentage rent also gives the landlord a window into tenant health long before a lease event forces the issue. Sales reported for overage are an early signal of which tenants are thriving and which are drifting toward a renewal they may not survive, which feeds directly into how the landlord plans the next leasing cycle.
CAM and the charges that sit outside rent
Rent is not the whole obligation. A shopping centre lease also passes through the cost of running the shared parts of the building, the common area maintenance charge, usually shortened to CAM. This covers the things no single tenant owns but everyone uses: the malls and walkways, security, cleaning, lighting, landscaping, shared HVAC, and the management of the centre itself.
CAM is normally allocated by floor area, so each tenant pays a pro rata share based on the space it occupies relative to the leasable total. This is where the anchor's size cuts the other way. The anchor pays little base rent per square metre, but because CAM follows area, it carries a large slice of the shared running costs simply by being large.
In practice anchor leases frequently negotiate CAM caps, exclusions, or fixed contributions, precisely because a strict pro rata share would hand the anchor a bill out of proportion to the rent it pays. A common pattern is for the anchor to pay a capped or fixed CAM amount while the specialty tenants absorb the remainder of the variable cost. That redistribution is one more way the small tenants end up funding the presence of the large one.
For anyone reading a rent roll, the lesson is that base rent alone understates what a tenant contributes and what a space costs to run. The full economic picture is base rent, plus percentage rent, plus the CAM and other recoveries, set against the cost of the floor area each tenant occupies. The anchor can look almost free on the base rent line and still be carrying real weight elsewhere in the building's accounts.
Co-tenancy: how the anchor sets everyone else's rent
The reason a small tenant accepts a high rent per square metre is co-tenancy, the principle that the value of a unit depends on who else trades in the centre. A unit beside a busy anchor that pulls thousands of visitors a day is worth more than the identical unit in a half-empty scheme. The small tenant is not only renting floor space; it is renting proximity to a flow of people it could not generate on its own.
This dependence is written directly into many specialty leases through a co-tenancy clause. Such clauses typically let the small tenant reduce rent, switch to a percentage-only arrangement, or in some cases terminate, if a named anchor goes dark or if occupancy across the centre falls below an agreed threshold. The clause exists because both sides understand that the rent was priced on the assumption the anchor would be there to deliver the traffic.
So the anchor's contribution shows up twice in the rent roll. Once as the gap between what the anchor pays and what its space would otherwise command, and again as the premium every surrounding tenant pays for access to the anchor's draw. When an anchor leaves, both reverse at the same time: the landlord loses a tenant and, through co-tenancy triggers, may see surrounding rents fall or leases break across the scheme. That cascade is why backfilling a departed anchor is treated as an emergency rather than a routine re-let.
It also explains a tension that runs through every anchor negotiation. The landlord knows the anchor is underpaying on a per-square-metre basis and supporting the whole rent roll. The anchor knows it. The leverage in the negotiation comes down to how much traffic the anchor actually delivers, and for most of the history of the shopping centre that number was argued from brand reputation and gut feel rather than measured.
Putting a number on the anchor's contribution
The weakest link in anchor lease economics has always been the evidence. Everyone in the room agrees the anchor drives traffic. Almost no one can say how much, to which other tenants, or whether the draw is holding up over the life of the lease. The landlord argues the anchor is worth its concessions; the anchor argues for more. Both are reasoning from sales data that arrives late and tells you what people bought, not how they moved.
Visitor data is what closes that gap. Counting how many people enter the centre, where they go, how their paths relate to the anchor, and how long they stay turns the anchor's contribution from an argument into a measurement. A few questions become answerable that base rent and sales alone cannot touch:
- Draw. What share of total centre visits pass through or visit the anchor, and how does footfall on anchor-led days compare with days the anchor is quiet or closed for refit?
- Spillover. Of the visitors who come for the anchor, how many continue into the rest of the centre rather than entering and leaving by the nearest door? This is the figure that justifies the premium specialty tenants pay.
- Dwell. How long does the anchor hold visitors in the building, and does longer time on site correspond to more of the centre being visited?
- Decay. Is the anchor's draw stable, growing, or slipping over the years of a long lease, which is the early warning a landlord wants well before a renewal or a co-tenancy trigger forces the issue?
Used at the negotiating table, this reframes the conversation. Instead of a landlord and an anchor trading assertions, both can look at the same measured draw and spillover and price the lease against it. An anchor that demonstrably feeds the rest of the centre has a strong case for its concessions. An anchor whose measured spillover is thin, where most visitors enter and exit without touching the wider scheme, is worth far less than its floor area suggests, and the lease can be priced accordingly.
An illustrative worked model
Pull the pieces together into one simplified example. The figures are illustrative, chosen to show how the parts interact rather than to represent any real centre or market rate.
Take a centre with three tenant positions on the rent roll:
- The anchor. 12,000 square metres at 80 per square metre base rent, so 960,000 a year, plus 2 percent percentage rent above a 48 million natural breakpoint, plus a capped CAM contribution.
- Specialty tenants. 8,000 square metres in total at an average of 600 per square metre, so 4.8 million a year in base rent, carrying the bulk of variable CAM, with co-tenancy clauses tied to the anchor.
- Vacant or marginal units. A small share of space whose lettability rises and falls with the perceived strength of the anchor and the centre's overall footfall.
On the base rent line the anchor looks like the landlord's worst deal: a third of the building for one sixth of the base rent. But trace the dependencies. If the anchor leaves, suppose half the specialty tenants can invoke co-tenancy to cut rent by, for example, 20 percent, and a quarter eventually leave as their trade falls. The landlord is not only losing 960,000 in anchor base rent; it is exposing several million in specialty rent and watching the marginal units slide toward vacancy. Measured against that exposure, the cheap anchor rent is cheap insurance.
Now layer in measurement. Suppose visitor data shows the anchor accounts for a large share of centre visits and that a high proportion of anchor visitors go on to spend time in the wider scheme. That measured spillover is the quantified version of the co-tenancy premium: it is the reason the specialty rents are defensible. If instead the data showed that most anchor visitors entered and left without touching the rest of the centre, the same rent roll would look fragile, and the landlord would be right to push the anchor harder on rent or to plan for a different draw. The numbers are illustrative, but the method is the point: the lease economics only make sense once the anchor's draw and spillover are measured rather than assumed.
Where the measurement comes from
Quantifying draw, spillover, and dwell across a centre means counting visitors and following how they move between the anchor and the rest of the scheme, without identifying anyone or relying on the patchy, late sales data that lease negotiations have leaned on for decades.
Ariadne measures this with Hybrid Fusion, its patented camera-free method. Time-of-Flight depth sensing counts every visitor at the entrances, capturing geometry rather than images, while patented phone signal sensing follows movement through the interior, detecting the signals a phone emits even in airplane mode. The sensor streams both feeds to Ariadne, where Hybrid Fusion combines them into one trajectory per visit and computes counts, dwell, and paths. The streams carry no identifier: no MAC address, no device ID, no biometric data, and no camera is involved. Identifiers are stored only when a visitor explicitly opts in, which keeps the method GDPR-friendly and outside biometric territory.
For a shopping centre, that produces exactly the figures the lease economics need: how many people the centre draws, what share of them touch the anchor, how many continue into the specialty units, and how all of that trends over the years of a long anchor lease. The wider operating context for centre owners sits on the shopping centres hub, and the underlying measurement approach is set out under people counting. The product is a small part of this story. The larger point is that anchor tenant lease economics has always rested on a claim about traffic, and that claim is finally something a centre can measure rather than argue.
FAQ
Why do anchor tenants pay so little rent per square metre?
Because the landlord is buying the visitor draw the anchor generates, not just renting it floor space. A strong anchor lifts the rent every other tenant in the centre can be charged, so the landlord can afford to let the anchor's large footprint at a low rate, or even at close to zero, and still come out ahead across the whole rent roll.
What is percentage rent and how is the breakpoint set?
Percentage rent is an additional rent the tenant pays on sales above an agreed threshold called the breakpoint, on top of a low fixed base. A natural breakpoint is the base rent divided by the percentage rate, so percentage rent begins exactly where the tenant's sales have earned back its base. For example, a 960,000 base at a 2 percent rate gives a 48 million natural breakpoint.
How does an anchor departure affect other tenants' rent?
Through co-tenancy clauses. Many specialty leases let the tenant cut rent, switch to percentage-only terms, or terminate if a named anchor goes dark or centre occupancy falls below a threshold. So an anchor leaving can trigger rent reductions and lease breaks across the scheme at once, which is why landlords treat backfilling an anchor as urgent.
Can you actually measure an anchor's contribution to a centre?
Increasingly, yes. Counting centre visits and following how visitors move between the anchor and the rest of the scheme quantifies the anchor's draw, the spillover into specialty units, and dwell time, and shows whether that draw is holding up over the lease. That turns the anchor's value from an argument into a measured figure both sides can price against.


