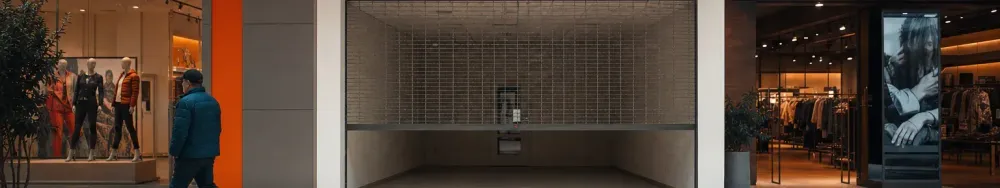
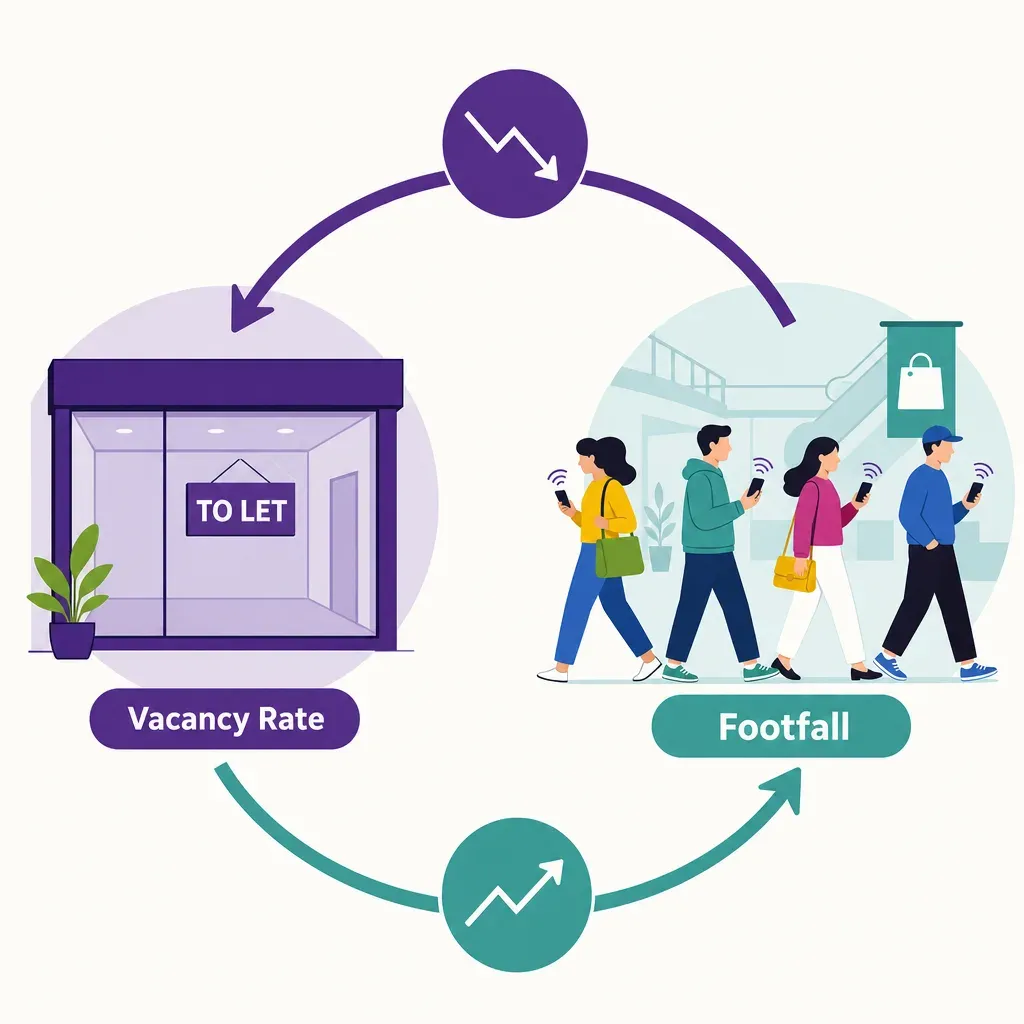
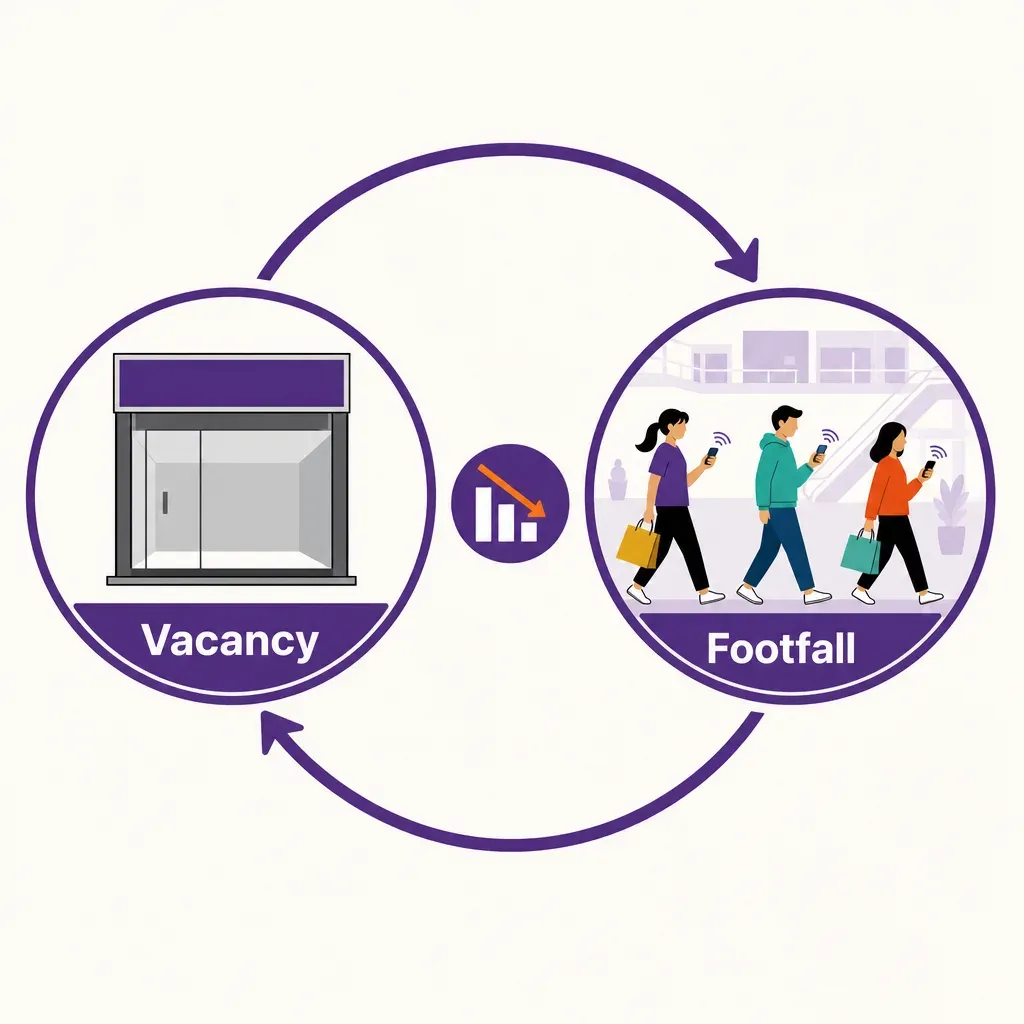
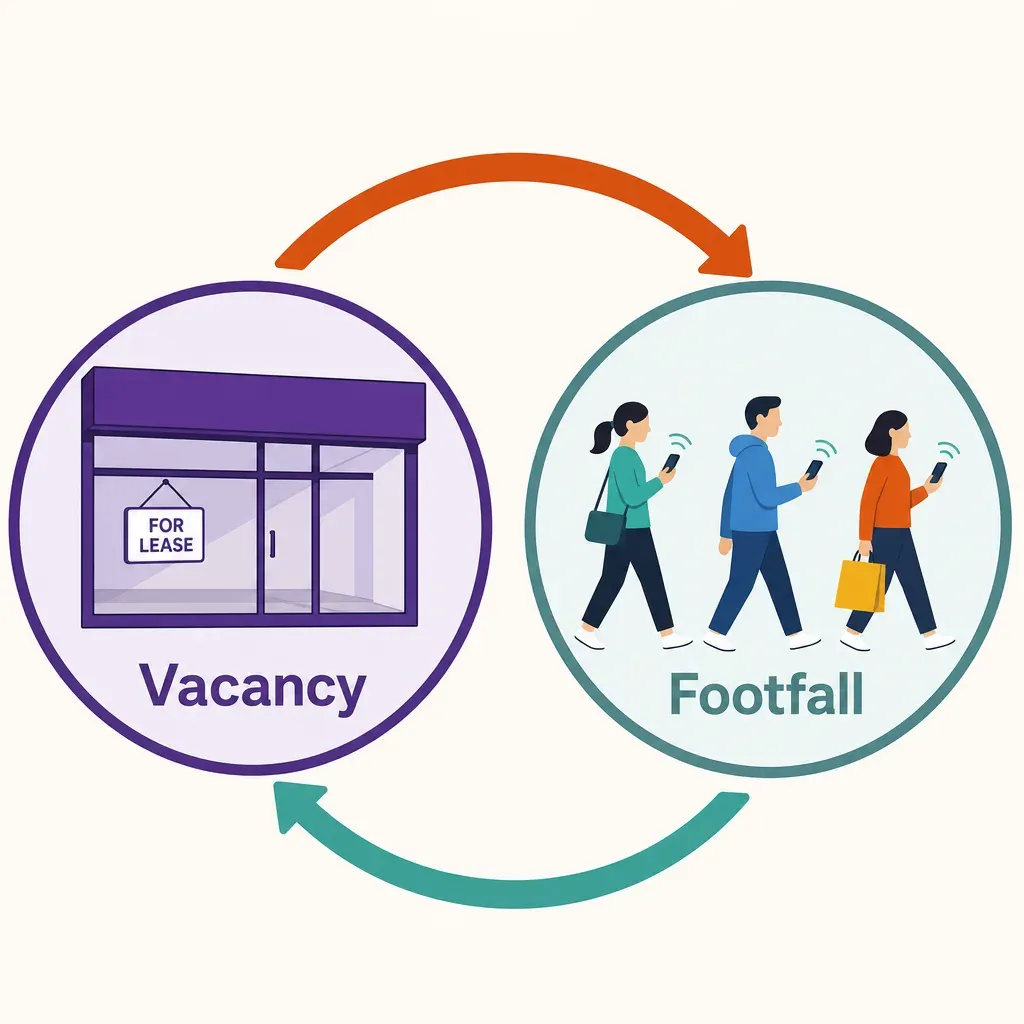
Vacancy and footfall are the same problem from two ends
A shopping centre lives or dies on two numbers that managers usually track in different reports. Vacancy rate, the share of leasable space sitting empty, lives in the leasing and finance view. Footfall, the count of people walking through the doors, lives in the operations and marketing view. They are treated as separate, but they are the same problem seen from two ends. Empty units make a centre less worth visiting, fewer visits make units harder to let, and harder-to-let units stay empty for longer. Once that loop starts turning the wrong way it does not correct itself, and by the time it shows up in a leasing report the damage is months old. This guide is about the link between the two numbers, how the downward spiral works, and why footfall is the early-warning signal that lets you break it before vacancy hardens.
How the downward spiral works
The doom loop is mechanical, not mysterious. It runs in a predictable order, and every step makes the next one more likely:
- A unit goes dark. A tenant leaves at lease end or closes early. One empty shopfront is cosmetic, not yet a problem.
- The draw weakens. If the empty unit was a reason people came, or sat on a route between two reasons they came, the part of the centre around it sees fewer passers-by.
- Neighbours feel it. Shops near the gap lose the spillover traffic the departed tenant used to send their way, so their own sales soften even though nothing changed in their store.
- Renewals get harder. Those weaker neighbours negotiate harder at renewal or decide not to renew, and a prospective tenant looking at the space sees a quiet stretch rather than a busy one.
- Vacancy rises again. A second unit empties, the dead zone widens, and the centre is now one loop deeper than where it started.
The reason this is dangerous is that each turn of the loop is small. No single departure looks like a crisis. The spiral is the accumulation of small, locally reasonable decisions, which is exactly why it is easy to miss until a whole wing has gone quiet.
Why footfall is the leading indicator and vacancy is the lagging one
Vacancy rate is a true number, but it is a slow one. A struggling tenant does not vanish overnight. Sales fade, the operator hangs on through a lease term, and only at lease end does the unit actually empty and the vacancy number move. By then the cause, a stretch of the centre that people stopped walking through, has been visible in the footfall data for many months. That is the whole argument in one sentence: footfall changes first, vacancy changes last.
Sales reports sit in between, and they are better than vacancy but still slow and noisy. Tenant sales arrive after the period closes, often weeks later, and they blend footfall with conversion, pricing, weather, and the operator's own merchandising. A drop in a tenant's sales does not tell you whether fewer people walked past or the same number walked past and bought less. Footfall separates those. It is the one signal that moves at the speed of the problem, not the speed of the accounting cycle.
- Footfall by zone shows you a wing going quiet weeks or months before a tenant there reports falling sales.
- Sales reports confirm the damage after it has happened, and mix several causes into one figure.
- Vacancy rate records the outcome last of all, once a unit has actually emptied and the loop has already turned.
What to watch in the footfall data
A single centre-wide footfall total is not enough to catch a spiral early, because the spiral is local. A wing can be cooling while the headline number holds up on the strength of a strong anchor at the other end. The signals worth watching are the ones that expose where attention is leaking:
- Zone-level footfall, not just the front door. Count entries to the building and movement past key internal points, so you can see one corridor losing traffic while the centre as a whole looks steady.
- Capture between zones. Track what share of people who reach one part of the centre carry on to the next. A falling pass-through past a gap is the spiral starting before any tenant complains.
- Dwell time by area. People who linger are people who browse and buy. A wing where dwell is shrinking is losing its pull even if raw counts have not dropped yet. Compare areas against your own history with mall dwell time benchmarks rather than against a borrowed industry figure.
- Anchor pull-through. Watch how much of the traffic an anchor draws actually reaches the smaller units around it. When that share falls, the anchor tenant is still doing its job at its own door but is no longer feeding its neighbours, which is an early sign a stretch is going dead.
Using footfall to break the loop before sales reports do
The point of an early signal is to act while action is still cheap. A widening vacancy is expensive to reverse because it asks a prospective tenant to bet on a quiet space. A cooling footfall trend is far cheaper to reverse because the space is still occupied and still has traffic to defend. Footfall data turns leasing from a reaction into a plan:
- Defend the at-risk neighbour first. When a zone's footfall starts to soften, the tenants in it are the next dominoes. Bring forward a renewal conversation, adjust an incentive, or programme an event into that wing while it still has visitors, rather than waiting for the sales report.
- Re-let with traffic evidence, not a hope. A prospective tenant evaluating an empty unit wants to know how many people pass it. Honest, measured footfall and dwell for that exact location is a far stronger leasing case than a centre-wide average, and it lets you price the space to its real draw.
- Steer movement on purpose. If the data shows people stopping short of a quiet stretch, you can re-route them: move a draw, an event, or signage to pull traffic through the cooling zone and re-warm the units there.
- Match the right tenant to the right flow. A unit on a high-traffic, short-dwell route suits a different occupier than one on a low-traffic, high-dwell route. Letting against the measured flow, rather than against a floor plan, keeps the loop from restarting.
None of this asks you to predict the future. It asks you to read the one number that moves first, treat a falling zone trend as the alarm it is, and spend leasing and marketing effort on the at-risk stretch while it is still cheap to hold.
An illustrative loop, with the assumptions stated
To make the timing concrete, here is a deliberately simplified illustration. The figures below are assumptions for the sake of the example, not measured data and not drawn from any study.
- Assume a mid-size centre where one fashion unit on a connecting corridor closes at lease end.
- Within weeks, zone footfall for that corridor and pass-through to the units beyond it begin to slide, while the centre-wide total barely moves because a strong anchor elsewhere holds it up.
- Months later, two neighbouring tenants report softer sales, and one signals it may not renew.
- Later still, the vacancy rate finally ticks up as the second unit empties, recording an outcome that the zone footfall trend flagged at the very first step.
The lesson of the illustration is the gap between when footfall moved and when vacancy moved. Reading the early signal buys you the months in between, which is the window in which the loop can still be broken.
How Ariadne measures footfall and dwell across a centre
Ariadne measures this with Hybrid Fusion, its patented camera-free method. Time-of-Flight depth sensing counts every visitor at the entrances, capturing geometry rather than images, while patented phone signal sensing follows movement through the interior, detecting the signals a phone emits even in airplane mode. The sensor streams both feeds to Ariadne, where Hybrid Fusion combines them into one trajectory per visit and computes counts, dwell, and paths. The streams carry no identifier: no MAC address, no device ID, no biometric data, and no camera is involved. Identifiers are stored only when a visitor explicitly opts in, which keeps the method GDPR-friendly and outside biometric territory.
For a shopping centre, that combination is what makes zone-level early warning possible. The device-independent body count at each entrance gives you a true count of who comes in, while the central fusion of movement through the interior gives you the per-zone footfall, pass-through, and dwell that a single front-door total cannot. Because the method is identifier-free by design, you can watch a wing cool and a corridor's pass-through fall without ever touching personal data, which keeps the analytics on the right side of GDPR. The shopping centre analytics platform brings entries, zones, and dwell into one view, so leasing and operations are reading the same early signal instead of two reports that disagree.
FAQ
Does a falling footfall always mean rising vacancy is coming?
Not always, but it is the strongest early warning you have. Footfall can dip for reasons that recover on their own, such as weather, roadworks, or a one-off event elsewhere. What matters is a sustained, zone-level decline, especially in pass-through and dwell around a specific stretch. That pattern is the one that tends to precede tenant trouble, which is why it is worth acting on before the sales report confirms it.
Why not just use tenant sales to spot the problem?
Tenant sales arrive after the period closes and mix footfall with conversion, pricing, and merchandising, so a drop does not tell you whether fewer people came or the same people bought less. Footfall isolates the traffic question and moves at the speed of the problem rather than the speed of the accounting cycle, so it gives you a cleaner and earlier signal.
Do you need cameras to measure footfall across a centre?
No. Ariadne counts with Hybrid Fusion: Time-of-Flight depth sensing plus patented phone signal sensing, never cameras. Time-of-Flight captures geometry rather than images, and signal sensing captures no MAC address by default, so the measurement involves no video, no faces, and no biometric data.