Ariadne is the only privacy-compliant smartphone technology solution that passively collects people flow data without apps, Wi-Fi, Bluetooth or network connections, and turns them into actionable insights - Plug-and-play technology with award-winning accuracy.
Ariadne team attended many exhibitions over the last few months and had the chance to analyze and create a report for exhibitors/attendees to better prepare for the future exhibitions. We have initiated a campaign, called "Booth Performance Measurement", which attracted a lot of demand from the exhibitors.
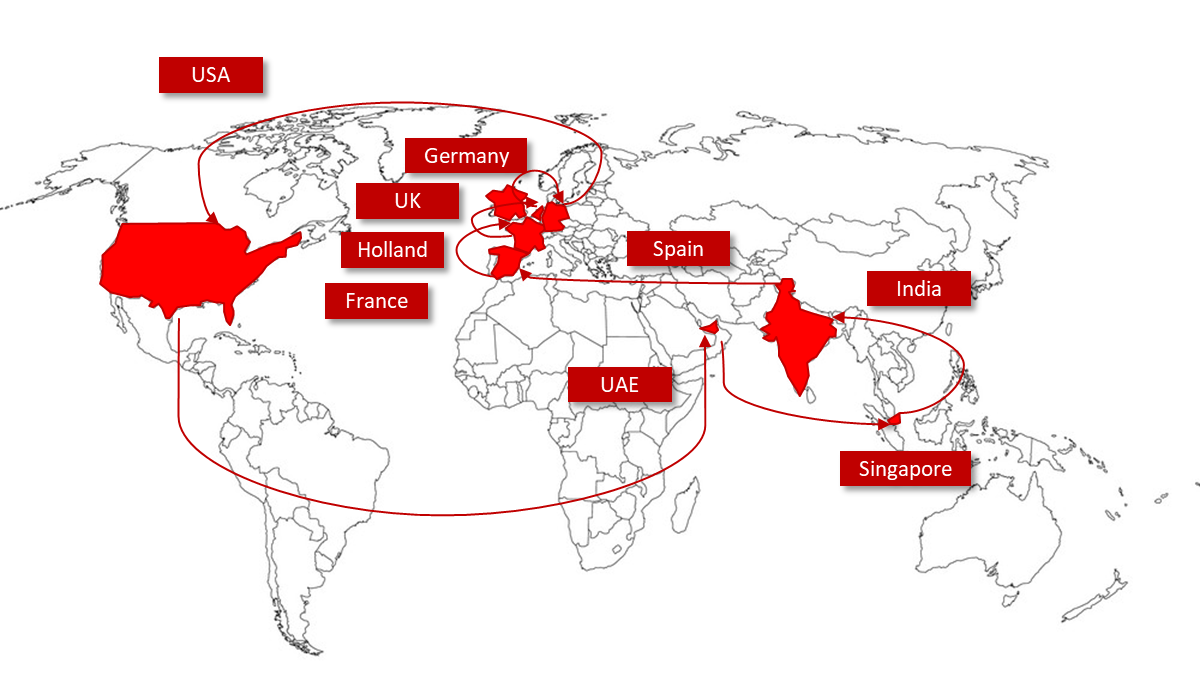
The report covers
- 9 Countries
- 8+ Exhibitions
- 100+ Exhibitors
- 100 000+ Visitors
Trajectory of Ariadne team throughout the world:
Outline
- Daily Visitor Trends
- Hourly Visitor Trends
- People Flow in the Exhibitions
- Booth Trends
- Downloads
- Webinar Recording
1) People Counting in Exhibitions
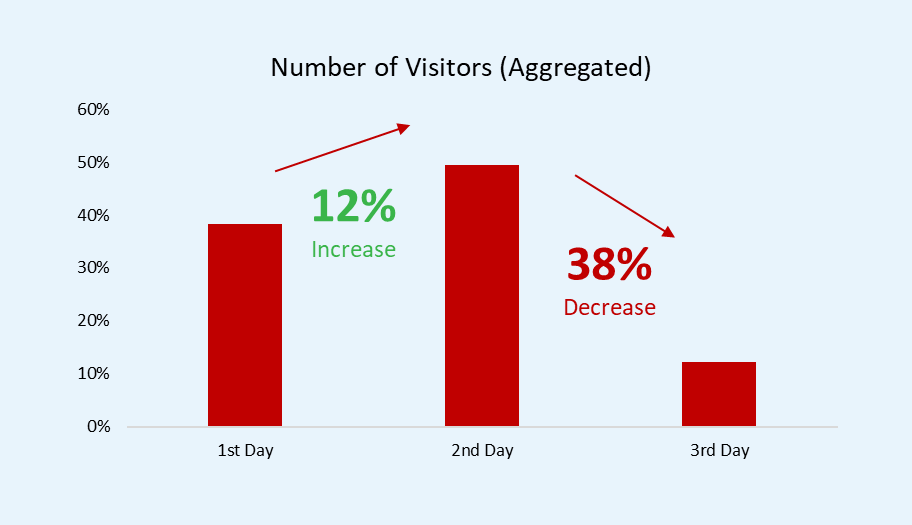
There is a strong trend in all of the exhibitions we have attended this year. The second day is always the busiest day (in 3-day exhibitions) and there is a 12% increase from the first day to second day. However, we see a very sharp decrease in number of visitors on the 3rd day, almost 40%.
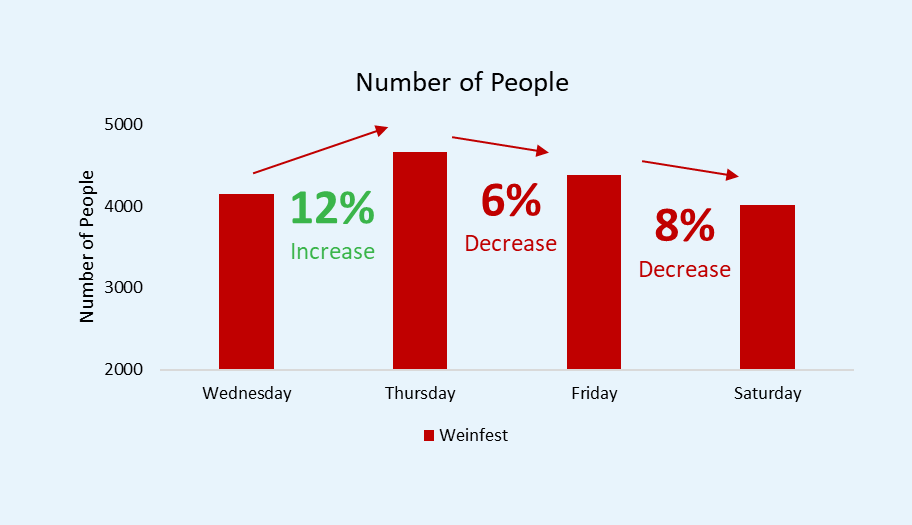
This trend is not something we are unfamiliar with. We have seen the same trend in our smart city projects. We see here too that the busiest day is the second day, and there is a consistent 12% increase from the first day. The third and the fourth day, as expected, had less visitation than the previous days.
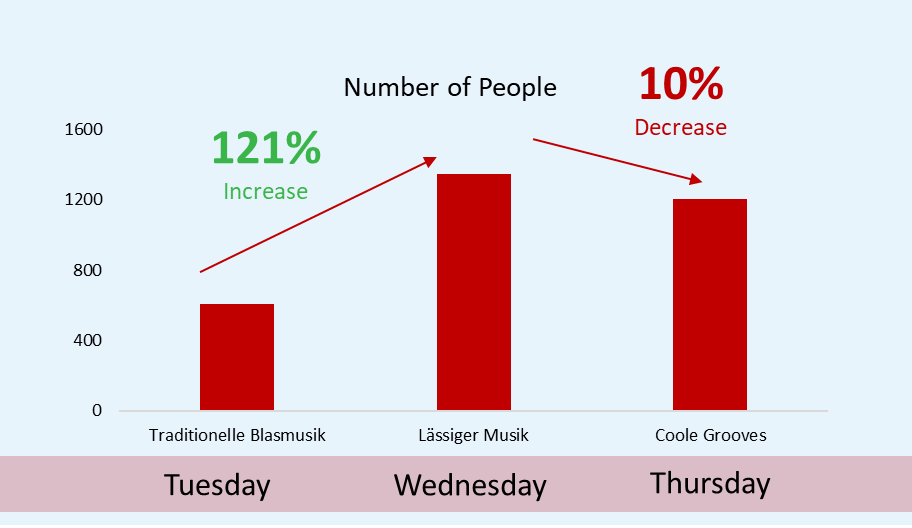
We went even further to analyze the best days for an event. In one of the projects, there were 3 exhibitions in a row, on Tuesday, Wednesday and Thursday. What we noticed is that the event happening on Wednesday has the most attendance, assuming there is a different event happening the day before.
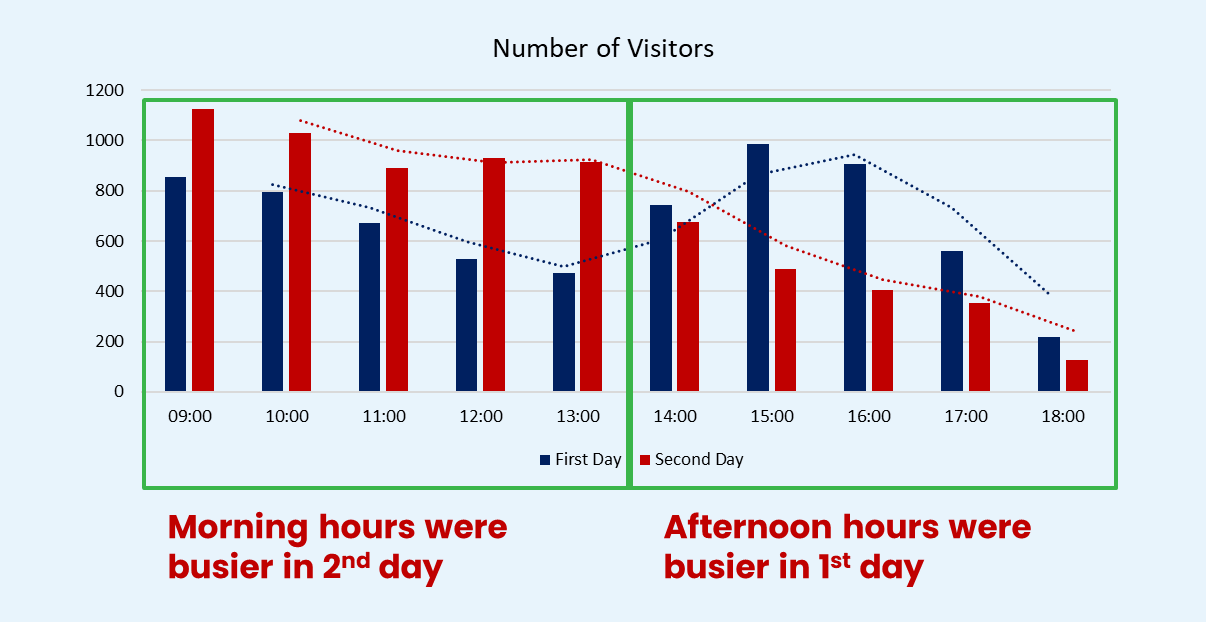
2) Hourly Visitor Trends
The chart below shows the number of visitors by hourly intervals. An eye-catching insight from the chart is that afternoon hours are usually busier during the first day, while morning hours are busier during the second day of an exhibition.
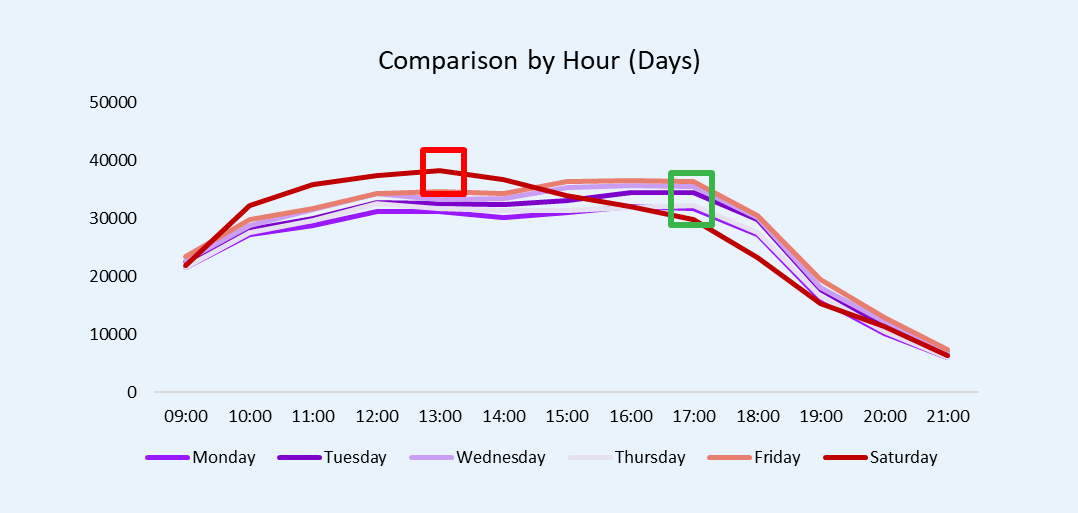
We can see a clear correlation to hourly visitation patterns in the shopping malls too, through the below example from one of Ariadne's customers. While within Mon-Fri, we see a clear peak on visitation around 17:00, on Saturday that peak comes earlier, around 13:00 and it drops significantly afterwards. A clear opportunity to start identifying what type of events/incentives can be offered to visitors to keep them longer in the venue!
3) People Flow in the Exhibitions
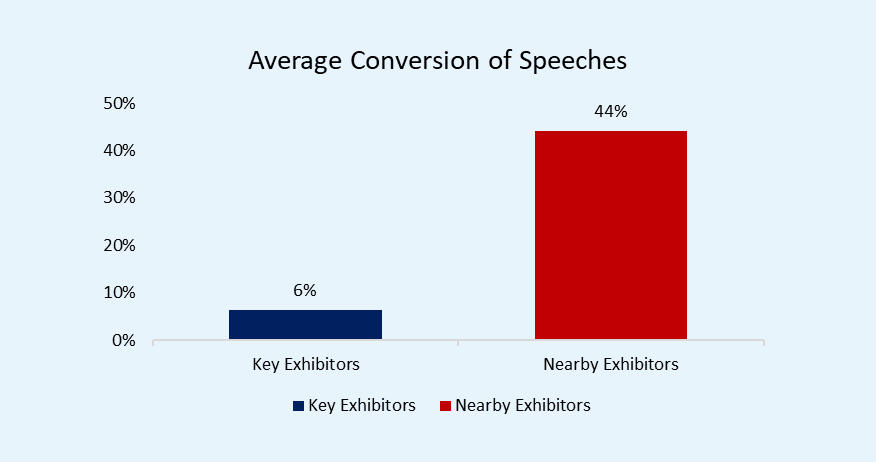
We also measured what was the immediate next stop of people that left the Speech Area after the end of the speech. The insight was that the nearby exhibitors attracted almost half of the people while some key exhibitors who were not close, didn’t get that much traffic.
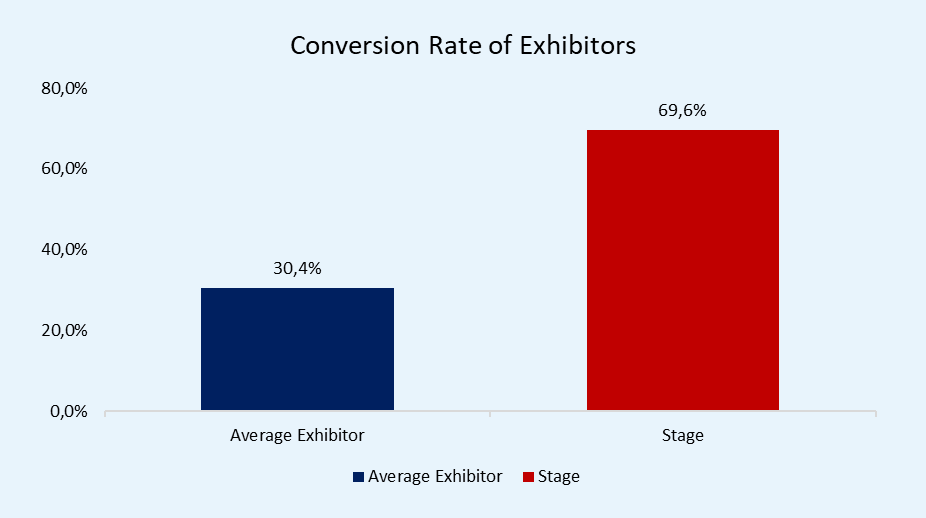
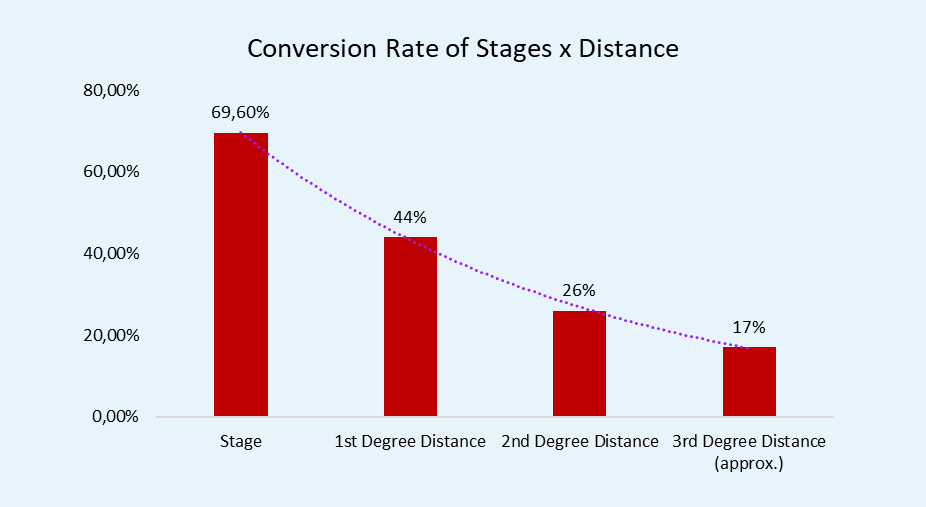
Another interesting finding is that people who visit the stage are more than twice more likely to visit other booths compared to people who did not visit the stage.
We also analyzed the conversion rate from Stage to Booths, pending on the distance. It’s logical that the further it gets the less probable is that the immediate next stop would be a more distant booth indeed, and we see this being confirmed from these numbers too. By 1st degree, we mean the immediate neighbour booths, and so on.
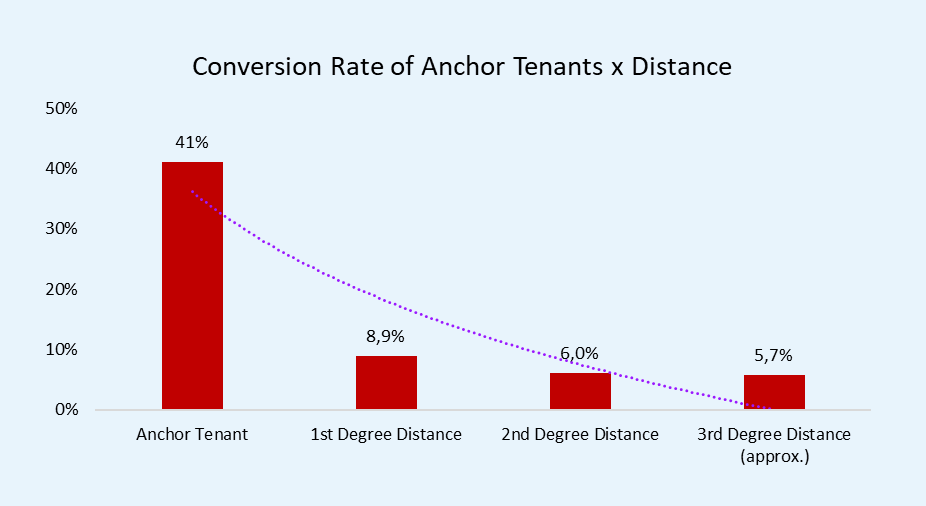
There is a similar trend in the malls. From our anchor tenant report, we have found that the closest stores get the most conversion from the anchor tenants. On average, 41% of the anchor tenant visitors visit also the other shops. And most of them (8.9%) go to the immediate neighbor stores and so on.
4) Booth Trends
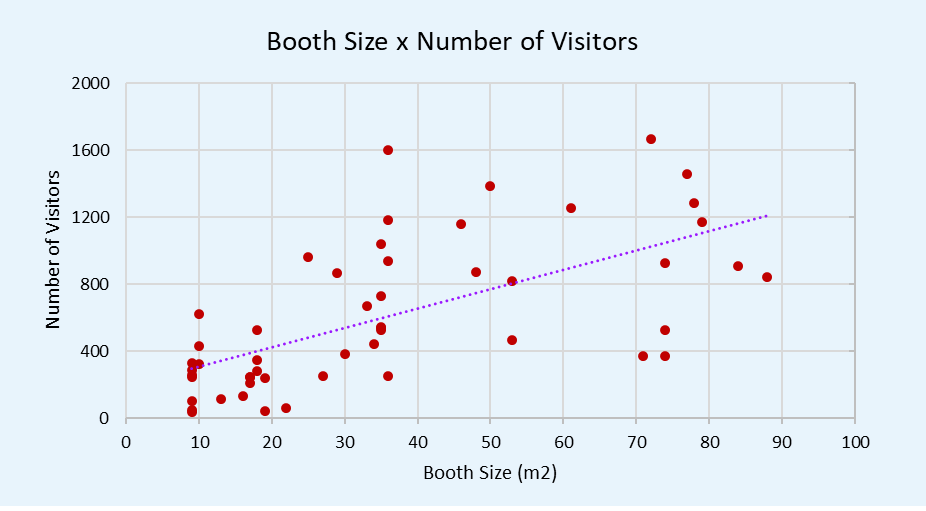
When we compare the booth size to the number of visitors, we land to the chart below. There is a clear correlation between the size of the booth and number of people visited. The larger it is, the more visitors it attracts.
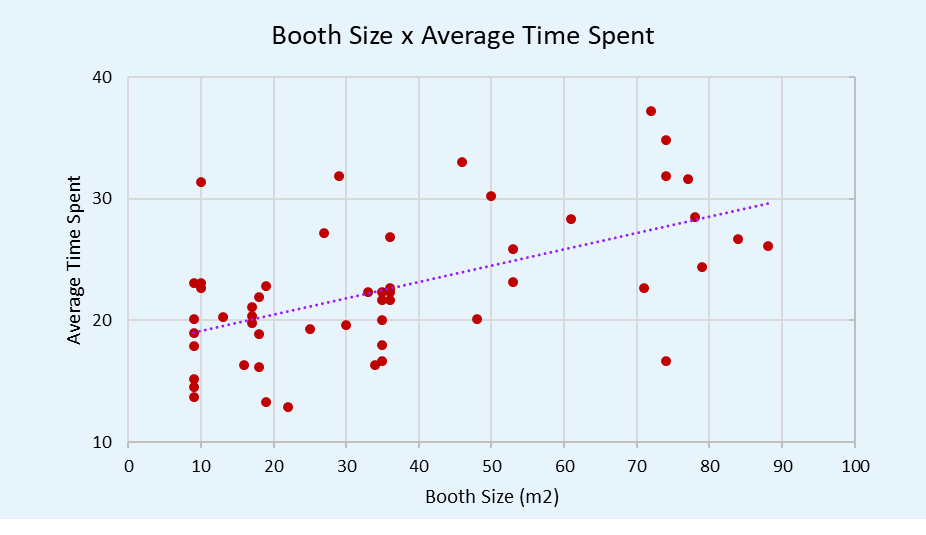
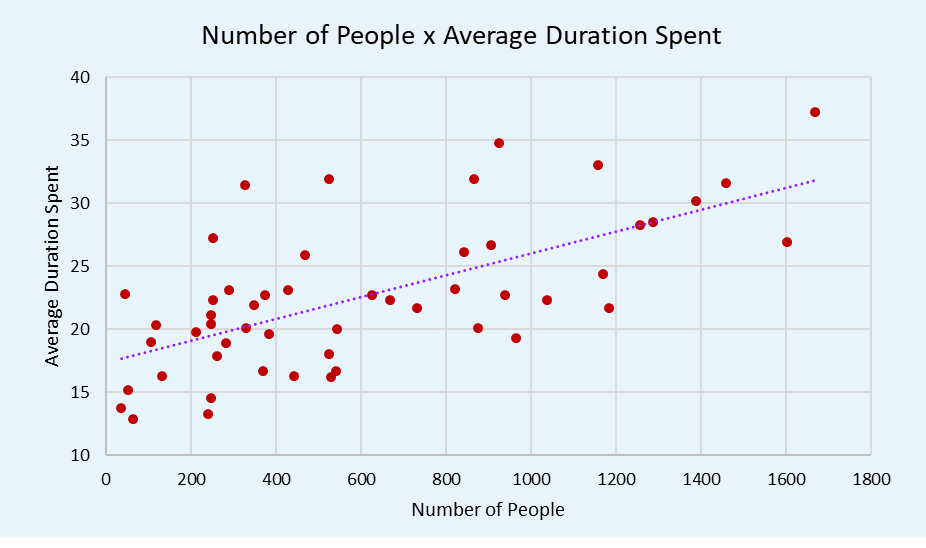
The same trend also exists for the average duration spent at booths. The larger the booth, the longer the visitor it engages.
We have also recorded the impact of the network effect in the exhibitions we attended. When there are many people in a booth, it attract more and more people, and keeps them longer in the booth.
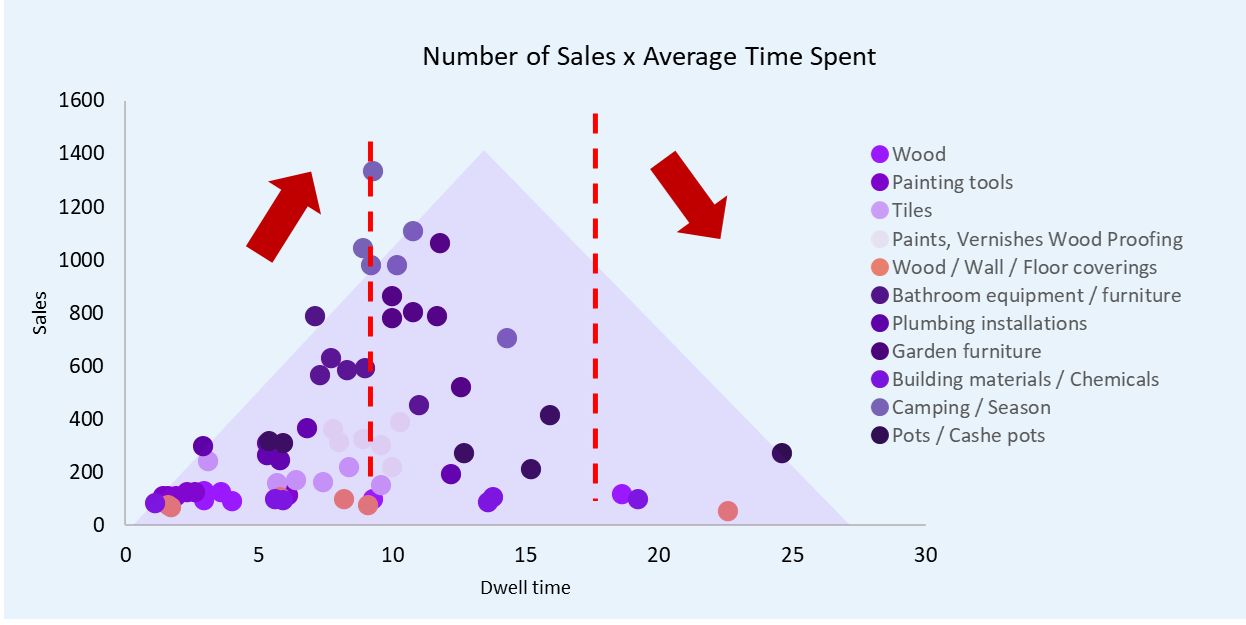
The insights above are not unique to the exhibitions. We have seen similar trends in our retailer clients. For example, the chart below visualizes the correlation of sales with the average time visitors spend in the store. We have seen that people are more likely to buy when they dwell around 10 minutes. However, when they spend more time in the shop (queuing etc.), then this likelihood decreases, which might be signaling that visitors need some asistance from the store associates.
Measure My Booth Success for Free
Thank you for reading through our report. If you would are interested in measuring your booth performance, please fill the form below or click here for more information.
Downloads
Smart City Expo World Congress Report
Webinar Recording